Every off-grid solar installer in Port Harcourt has had the same conversation. The client receives a system proposal, reads the capital cost figure, and asks how long it will take to pay back. The installer says two to three years. The client is sceptical. Two to three years seems implausibly short for a system costing ₦5 to ₦8 million, and the scepticism is reasonable, because the client is unconsciously comparing the solar capital cost against a monthly electricity bill that does not exist. There is no grid supply to displace. There is no utility bill to reduce.
What the client is actually spending money on every month is the generator. Fuel, oil, spark plugs, repairs, and the periodic replacement of a machine that was not designed to run eight hours a day in a tropical climate. Most clients have a rough sense of their monthly fuel spend. Very few have ever added the maintenance costs, the repair costs, and the amortised replacement cost of the generator itself to arrive at the true monthly cost of the power they are consuming.
When that calculation is done correctly, with current fuel prices, realistic maintenance intervals, and an honest assessment of how long a residential generator lasts under daily use in Port Harcourt, the monthly cost of generator-dependent power is almost always higher than the monthly equivalent cost of owning the solar system. The payback period is not a selling point invented by installers. It is the output of a straightforward arithmetic calculation, and this post provides the framework for producing it precisely for any client with a documented load profile and a known generator running cost.
The Correct Baseline, Generator Running Cost
The payback period for an off-grid solar system is only meaningful when it is calculated against the correct baseline. In a market with reliable grid supply, the baseline is the utility electricity bill the solar system displaces. In Nigeria, where grid supply for residential and small commercial customers averages two to four hours per day on a good week, the correct baseline is the generator running cost the solar system replaces. Using the grid electricity bill as the baseline in this market produces a payback period of twenty to forty years, which is arithmetically correct and completely misleading, because the grid supply that the solar system is being compared against does not actually power the building.
The true generator running cost has three components, each of which must be calculated and summed before the baseline figure is valid.
Component 1: Fuel Cost
A 5kVA petrol generator operating at 50 percent of its rated load consumes approximately 1.2 litres of petrol per hour. At eight hours of daily operation and a current Port Harcourt pump price of ₦1,400 per litre:
Daily fuel cost = fuel consumption x hours x fuel price
Daily fuel cost = 1.2 L/hr x 8 hr/day x ₦1,400/L = ₦13,440/day

Annual fuel cost = ₦13,440 x 365 = ₦4,905,600/year
Component 2: Maintenance Cost
A generator accumulating 2,920 hours per year requires maintenance at intervals that most residential owners either defer or underestimate. The minimum maintenance schedule for a petrol generator in continuous tropical use includes engine oil changes at 250-hour intervals, spark plug replacement at 500-hour intervals, air filter cleaning and replacement, and carburetor cleaning at 1,000-hour intervals:
Oil changes:₦15,000 x (2,920 / 250) = ₦175,200/year
Spark plugs: ₦8,000 x (2,920 / 500) = ₦46,720/year
Air filter: ₦5,000 x (2,920 / 500) = ₦29,200/year
Carburetor svc: ₦25,000 x (2,920 / 1,000)= ₦73,000/year
A quality 5kVA petrol generator in continuous residential use at 2,920 hours per year has a realistic service life of 3,000 to 5,000 hours, which means replacement every 1.0 to 1.7 years. At a replacement cost of ₦375,000 and an average replacement interval of 15 months:
Annual replacement amortisation = replacement cost / replacement interval in years
Annual replacement amortisation = ₦375,000 / 1.25 years = ₦300,000/year
The total annual generator running cost summing all three components:
Fuel cost: ₦4,905,600/year

Scheduled maintenance: ₦324,120/year

Unscheduled repairs: ₦150,000/year

Replacement amortisation: ₦300,000/year

Total annual running cost: ₦5,679,720/year (~₦5.68M/year)

Monthly equivalent: ₦473,310/month
Component
Calculation
Annual Cost
Fuel (1.2L/hr, 8hr/day, ₦1,400/L)
1.2 x 8 x 365 x ₦1,400
₦4,905,600
Scheduled maintenance
Oil, plugs, filter, carb
₦324,120
Unscheduled repairs
Mid-range estimate
₦150,000
Replacement amortisation
₦375,000 / 1.25yr
₦300,000
Total annual cost
₦5,679,720
The Payback Period Calculation
The payback period is the time required for the cumulative avoided generator running cost to equal the capital cost of the solar system. It is calculated from two figures: the capital cost of the system and the annual avoided cost established in Section 1.
Capital Cost of the Cluster System
Solar array: 6 x 400W panels -> ₦840,000
Victron SmartSolar MPPT 150/60 -> ₦320,000
Victron Multiplus-II 48/3000/35-32 -> ₦680,000
4 x Pylontech US3000C battery modules -> ₦2,800,000
Victron Cerbo GX + GX Touch 50 -> ₦280,000
VE.Can-to-CAN adapter -> ₦45,000
DC wiring, fuses, busbars, combiner box -> ₦180,000
Installation labour (3-day installation) -> ₦250,000
Total capital cost: -> ₦5,665,000
Payback Period
Payback period = capital cost / annual avoided cost
Payback period = ₦5,665,000 / ₦5,679,720 = 1.0 years
A payback period of one year is the correct arithmetic result at current Nigeria fuel prices. This figure is not a marketing claim. It is the output of the calculation, and it explains why the installer who quotes a two to three year payback period is being conservative rather than optimistic.
Sensitivity Analysis
Daily Generator Hours
₦1,000/L fuel
₦1,400/L fuel
₦1,800/L fuel
6 hours/day
1.8 years
1.3 years
1.0 years
8 hours/day
1.4 years
1.0 years
0.8 years
10 hours/day
1.1 years
0.8 years
0.6 years
Across the full range of realistic fuel price and daily usage assumptions for Port Harcourt residential installations, the payback period for the cluster system is between 0.6 and 1.8 years. Both ends of the range are well below the three-year payback period that installers commonly quote and clients commonly doubt.
Fuel Price Escalation and Its Effect on Payback
A payback period calculated at today’s fuel price treats the avoided cost as a fixed annual figure. This is arithmetically straightforward but economically incorrect in the Nigerian market, where petrol prices increased from approximately ₦165 per litre in January 2022 to approximately ₦1,100 per litre by December 2024 following subsidy removal, a 567 percent increase over three years, or approximately 107 percent per year on a compound basis.
A forward escalation assumption of 15 to 20 percent per year is materially below the historical rate and is the conservative input for a payback calculation that is intended to understate rather than overstate the financial benefit. The cumulative avoided cost with escalation is calculated using the standard geometric series:
Cumulative avoided cost with escalation over N years:
C_cumulative = A x [(1 – ((1+g)/(1+r))^N) / (r – g)]
Where:
A = annual avoided cost in year 1 (₦5,679,720)

g = annual escalation rate of avoided cost (0.15 to 0.20)

r = discount rate (0 for simple payback)

N = number of years
At a payback period of one year, the escalation assumption does not change the payback period because the capital cost is recovered within the first year regardless. The escalation assumption becomes critical in the 15-year TCO comparison, where it determines the cumulative generator cost over the full assessment period:
Year
Cumulative Fuel Cost (15% annual escalation)
Year 1
₦4,905,600
Year 3
₦17,874,662
Year 5
₦29,441,856
Year 10
₦86,868,617
Year 15
₦239,789,956
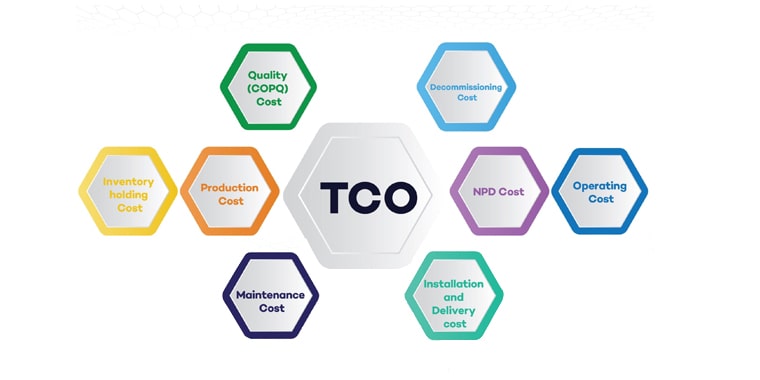
Total Cost of Ownership: off-grid solar vs generator in Nigeria
The total cost of ownership for an off-grid solar system is the sum of all costs incurred over a defined assessment period: the initial capital cost, the cost of replacing components that reach end of life, and the ongoing maintenance costs. A 15-year assessment period is used because it covers the expected service life of the panels, encompasses one battery replacement cycle at the cycle life projection established in Post #12: Battery Bank Sizing: 8 Critical Rules for BMS Selection in Off-Grid Systems, and provides a period long enough to make the TCO comparison with the generator alternative meaningful.
Component Lifetime Reference:
Solar panels (6 x 400W) -> 25+ years, no replacement within 15-year period

MPPT controller (SmartSolar 150/60) -> 10 to 15 years, possible replacement at year 12-15

Inverter (Multiplus-II 48/3000) -> 10 to 15 years, possible replacement at year 12-15

Battery bank (4 x Pylontech US3000C) -> 10-year warranty, replacement at year 10-12

Cerbo GX -> 10 to 15 years, possible replacement at year 12-15

DC and AC wiring -> 25+ years with correct installation
The battery bank replacement at year 10 to 12 is the largest single cost within the 15-year assessment period. Lithium battery prices have historically decreased rather than increased as production scale has grown, so the flat price assumption used below is a conservative upper bound:
Battery replacement at year 11 (flat price, conservative): ₦2,800,000
Inverter + MPPT replacement at year 13 (if required): ₦1,000,000
The 15-year generator TCO applies the annual running cost from Section 1 with 15 percent annual escalation and accounts for the 12 generator replacements that occur within the 15-year period at the replacement interval established in Section 1.
Annual fuel cost in year N = ₦4,905,600 x (1.15)^(N-1)
Cumulative fuel cost over 15 years:
= ₦4,905,600 x [(1.15^15 - 1) / 0.15] = ₦4,905,600 x 47.58 = ₦233,434,080
Cumulative maintenance cost over 15 years (15% escalation):
= ₦474,120 x 47.58 = ₦22,558,590
Generator replacements: 15 years / 1.25 years = 12 replacements
The generator alternative costs 25 times more than the off-grid solar system over a 15-year period at 15 percent annual fuel price escalation. At zero escalation, flat fuel prices for 15 years, which has never occurred in the Nigerian market, the 15-year generator TCO at ₦85,190,800 is still more than 8 times the solar TCO of ₦10,515,000.
Net Present Value Analysis
The payback period and TCO comparison in Sections 2 through 5 treat all future costs as equivalent to present costs. The net present value analysis corrects for this by discounting future cashflows at a rate that reflects the cost of capital. In Nigeria’s current economic environment, the appropriate discount rate for a naira-denominated investment analysis is 20 to 25 percent per year, reflecting the commercial lending rate available to a small business or high-net-worth individual.
NPV = Σ [C_t / (1 + r)^t]
Where:
C_t = cost in year t (₦)

r = discount rate

t = year (0 to 15)
Applying a 20 percent discount rate to both options over 15 years:
Solar NPV of total costs at 20% discount rate:

Year 0 capital: ₦5,665,000 / (1.20)^0  = ₦5,665,000

Year 11 battery: ₦2,800,000 / (1.20)^11 = ₦376,850

Year 13 inverter+MPPT: ₦1,000,000 / (1.20)^13 = ₦93,466

Annual maintenance PV: ₦70,000 x 4.675 = ₦327,250

Solar NPV of total costs: ₦6,462,566
Generator NPV of total costs at 20% discount rate:
Net effective discount rate on escalating costs: (1.20/1.15) - 1 = 4.35%
The NPV analysis in a high-inflation, high-discount-rate environment like Nigeria’s actually makes the solar case stronger than a flat cost comparison, not weaker. The solar system’s costs are concentrated at year zero where discounting has no effect. The generator’s costs are back-loaded and subject to the full force of discounting at a high rate, yet still produce an NPV nine times higher than the solar alternative.
The Disruption Cost: What the Numbers Do Not Capture
The TCO and NPV calculations in Sections 4 through 6 are complete financial analyses of the costs that can be quantified from known inputs. They do not capture one category of cost that every generator-dependent household and business in Port Harcourt experiences regularly and that off-grid solar owners consistently cite as their primary motivation for the investment: the cost of the days when the generator does not run because fuel is not available.
Fuel scarcity in Port Harcourt is not a hypothetical risk. It is a recurring event that has occurred multiple times per year in every year of the past decade, typically lasting two to five days per event and sometimes extending beyond a week during periods of supply chain disruption or government price intervention. During a fuel scarcity event, a generator-dependent household faces a power outage regardless of what the fuel costs, because the fuel simply cannot be obtained at any price in the immediate vicinity.
The cost of a 48-hour power outage for a residential household is difficult to quantify precisely but straightforward to describe: food spoilage in a refrigerator and freezer that may represent ₦50,000 to ₦150,000 in lost groceries, lost productivity for any household member working from home, discomfort during the hottest part of the dry season when ambient temperatures reach 38 to 42 degrees Celsius without air conditioning, and the cumulative erosion of confidence in the reliability of the power supply that affects decisions about what appliances to purchase, what food to stock, and what business activities to conduct from the premises.
The off-grid solar system does not merely reduce the cost of power. It eliminates the category of risk represented by fuel scarcity entirely. The battery bank provides autonomy through a multi-day fuel scarcity event at any time of year, and the solar array recharges the bank each day without any dependence on a supply chain that has demonstrated its unreliability.
Disruption Cost Reference:
Fuel scarcity frequency -> multiple events per year, 2 to 7+ days per event
Residential outage cost -> ₦50,000 to ₦150,000 per 48-hour event
Small business outage cost -> revenue loss proportional to daily turnover
Solar autonomy during scarcity -> 2+ days at rated demand without solar recharge
Client conversation framing -> solar reduces cost AND eliminates a category of risk
Financing and Cash-Flow Positive Operation
The payback period calculation in Section 2 assumes the client pays the full capital cost upfront. For many clients in Port Harcourt, the upfront capital requirement is the primary barrier to solar adoption, not the financial return. Financing converts the capital cost into a monthly payment stream and changes the client’s decision from a lump-sum investment question to a monthly cash flow question: is the monthly loan payment less than the monthly generator running cost the system eliminates?
The monthly payment on a financed solar system is calculated using the standard loan annuity formula:
Monthly payment = P x [r_m x (1 + r_m)^n] / [(1 + r_m)^n – 1]
Where:
P = principal (₦5,665,000)

r_m = monthly interest rate (annual rate / 12)

n = number of monthly payments

At 24% annual interest (r_m = 2%/month) over 36 months:

Monthly payment = ₦5,665,000 x [0.02 x (1.02)^36] / [(1.02)^36 - 1] = ₦5,665,000 x 0.03923 = ₦222,188/month
The monthly payment of ₦222,188 compares directly against the monthly generator running cost of ₦473,310. The financed solar system costs ₦251,122 less per month than the generator it replaces from the first month of operation. Over the 36-month loan term the client saves ₦9,040,392 in generator costs against total loan payments of ₦7,998,768, a net benefit of ₦1,041,624 during the loan term alone.
Item
Value
System capital cost
₦5,665,000
Loan terms
36 months at 24% annual interest
Monthly loan payment
₦222,188
Monthly generator cost avoided
₦473,310
Monthly saving from day one
₦251,122
Total saving over loan term
₦9,040,392 avoided vs ₦7,998,768 paid
Net benefit during loan term
₦1,041,624
Cash-flow positive from
Month one of operation
FAQ
How much does generator power cost per year in Nigeria?
A typical Nigerian household running a 3.5kVA generator for 10 hours per day spends between N19,000 and N31,500 per day on fuel alone at current petrol prices of N950 to N1,050 per litre. Over a full year that compounds to over N5 million in fuel. Adding engine oil changes every 250 hours, spark plugs, air filter replacements, and the periodic cost of replacing a generator running under daily load in a tropical climate brings the true annual cost significantly higher than the fuel figure alone.
How long does it take for off-grid solar to pay back in Nigeria?
The payback period depends on the correct baseline. In Nigeria where grid supply averages two to four hours per day, the baseline is not a utility electricity bill — it is the generator running cost being displaced. When the solar capital cost is compared against the full annual generator TCO including fuel, maintenance, and replacement, the payback period for a correctly sized off-grid system is typically one to three years. After payback, the solar system produces power at near-zero marginal cost while generator costs continue compounding with fuel price escalation.
Is generator power more expensive than solar in Nigeria long term?
Yes, significantly. At 15% annual fuel price escalation — which is conservative given Nigeria’s historical fuel price trajectory — the 15-year generator TCO is approximately 25 times the off-grid solar system TCO. Even at zero fuel price escalation, which has never occurred in the Nigerian market over any sustained period, the 15-year generator TCO remains more than 8 times the solar alternative. The NPV analysis at a 20 to 25% discount rate, appropriate for naira-denominated investments at current lending rates, makes the solar case stronger rather than weaker because solar costs are front-loaded while generator costs compound at a high rate over time.
What are the hidden costs of running a generator in Nigeria?
Beyond fuel, the full generator cost includes engine oil changes every 250 operating hours, air filter and spark plug replacements, carburetor servicing, AVR maintenance, and the cost of generator replacement when the machine reaches end of service life. A residential generator running 8 to 10 hours per day in Nigeria’s tropical heat typically lasts 3 to 5 years before requiring major overhaul or replacement. The opportunity cost of generator-related power cuts when fuel is unavailable — which every Lagos, Port Harcourt, and Abuja resident experiences regularly — is the one cost that cannot be fully quantified but is consistently cited by solar system owners as their primary motivation for switching.
What happens to the solar payback calculation if fuel prices fall?
Even in the best-case scenario of flat fuel prices for the entire analysis period, which has not occurred in Nigeria over any sustained period, the solar system remains the more economical choice over 10 to 15 years. The payback period extends from 1 to 2 years to 2 to 4 years at flat prices, but the long-term TCO advantage of solar does not disappear. The risk profile also differs: solar costs are fixed at purchase while generator costs are exposed to fuel price volatility, naira depreciation, and supply disruptions that are outside the owner’s control.
Should I choose off-grid solar or a hybrid system in Nigeria?
If your site has any DISCO grid supply at all, even 2 to 4 hours per day, a hybrid system is worth evaluating before committing to pure off-grid. A hybrid system uses grid availability to reduce the battery bank size required, which reduces capital cost. The generator elimination argument that applies to off-grid solar applies equally to hybrid — both displace the generator as the primary power source. The deciding factors are the reliability and hours of your DISCO supply, your load profile, and whether you want the grid management and time-of-use optimisation features that a hybrid inverter provides.
Conclusion
The client who asked how long the payback would take deserved a specific answer backed by specific numbers. The answer, at current Port Harcourt fuel prices and a realistic assessment of generator running costs, is approximately one year. The client who doubted that figure was comparing the wrong baseline. They were measuring the solar investment against a grid electricity bill that does not exist rather than against the generator running cost that does.
The financial case for off-grid solar in Port Harcourt is not built on optimistic assumptions. The payback period of one year is calculated from conservative inputs: a generator fuel consumption figure that assumes good engine condition, a maintenance cost that assumes proper servicing, a replacement interval that assumes the generator is not abused. A generator running on overdue oil changes, in a flooded compound during the rainy season, on fuel of uncertain quality from a jerry can, will cost more and last less than the figures in this post. The solar case is the conservative case.
The 15-year TCO comparison produces a ratio of 25 to 1 in favour of solar at 15 percent annual fuel price escalation. At zero escalation, flat fuel prices for 15 years, which has never occurred in the Nigerian market, the ratio is 8 to 1. The NPV analysis at a 20 percent discount rate produces a ratio of 9 to 1 by correctly accounting for the time value of money. None of these calculations include the disruption cost of fuel scarcity events, which are unquantified in this post but consistently cited as the primary motivation by clients who have already made the investment.
The framework in this post produces a specific, defensible, client-facing financial analysis for any system whose capital cost and load profile are known. Apply Section 1 to calculate the generator baseline. Apply Section 2 to calculate the payback period. Apply Sections 4 and 5 to produce the 15-year TCO comparison. Apply Section 8 to convert the capital cost into a monthly payment and compare it directly against the monthly generator cost. The numbers do the rest.
I am Engr. Ubokobong Ekpenyong, a solar specialist and lithium battery systems engineer with over five years of hands-on experience designing, assembling, and commissioning off-grid solar and energy storage systems. My work focuses on lithium battery pack architecture, BMS configuration, and system reliability in off-grid and high-demand environments.
It’s interesting to see how off-grid solar can really pay for itself in such a short time, especially considering how much is spent on generator maintenance and fuel. I think the biggest challenge is getting people to understand the true cost of generators, which isn’t just the initial purchase but the ongoing operating costs.
Contains information related to marketing campaigns of the user. These are shared with Google AdWords / Google Ads when the Google Ads and Google Analytics accounts are linked together.
90 days
__utma
ID used to identify users and sessions
2 years after last activity
__utmt
Used to monitor number of Google Analytics server requests
10 minutes
__utmb
Used to distinguish new sessions and visits. This cookie is set when the GA.js javascript library is loaded and there is no existing __utmb cookie. The cookie is updated every time data is sent to the Google Analytics server.
30 minutes after last activity
__utmc
Used only with old Urchin versions of Google Analytics and not with GA.js. Was used to distinguish between new sessions and visits at the end of a session.
End of session (browser)
__utmz
Contains information about the traffic source or campaign that directed user to the website. The cookie is set when the GA.js javascript is loaded and updated when data is sent to the Google Anaytics server
6 months after last activity
__utmv
Contains custom information set by the web developer via the _setCustomVar method in Google Analytics. This cookie is updated every time new data is sent to the Google Analytics server.
2 years after last activity
__utmx
Used to determine whether a user is included in an A / B or Multivariate test.
18 months
_ga
ID used to identify users
2 years
_gali
Used by Google Analytics to determine which links on a page are being clicked
30 seconds
_ga_
ID used to identify users
2 years
_gid
ID used to identify users for 24 hours after last activity
24 hours
_gat
Used to monitor number of Google Analytics server requests when using Google Tag Manager
1 minute
You can find more information in our Cookie Policy and .


")
")
")
")


It’s interesting to see how off-grid solar can really pay for itself in such a short time, especially considering how much is spent on generator maintenance and fuel. I think the biggest challenge is getting people to understand the true cost of generators, which isn’t just the initial purchase but the ongoing operating costs.