
QUICK ANSWER
How much do solar panels degrade per year?
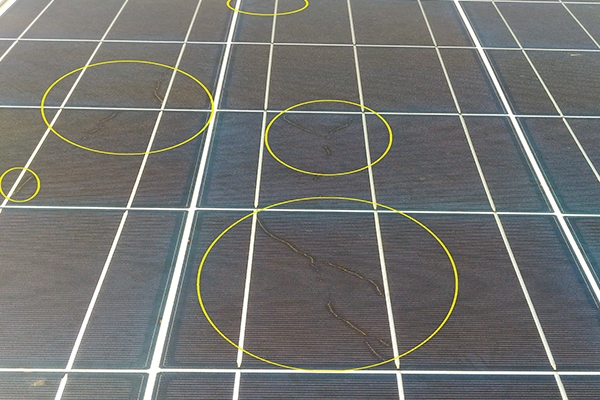
Solar panel degradation in Nigeria is not theoretical, it is measurable, cumulative, and financially significant.
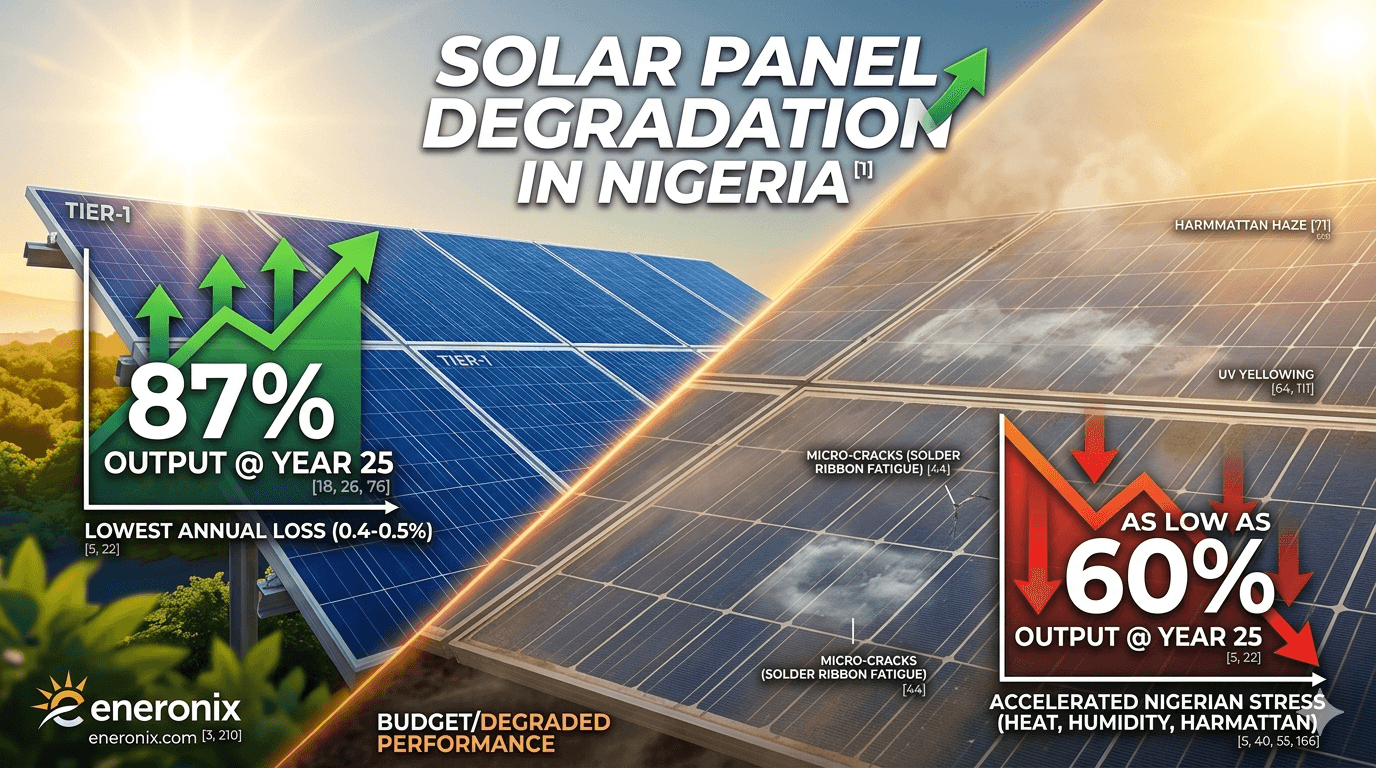
Tier-1 monocrystalline PERC solar panels typically degrade at 0.40–0.50% per year, leaving about 86–88% of original output after 25 years. Budget-grade panels degrade faster, at 1.0–2.0% per year, which can reduce performance to around 60% of rated capacity over the same period.
In Nigeria, high ambient temperatures, humidity, and prolonged UV exposure increase stress on encapsulants, solder joints, and silicon cells. This can add an additional 0.05–0.30% annual degradation penalty, depending on installation quality and ventilation.
Over a full system lifetime, this difference compounds significantly, often translating into millions of naira in lost energy yield for mid-to-large residential systems.
Most system owners understand degradation in theory, but few quantify it in real operational terms:
- What does a panel actually produce in year 5, 10, and 20?
- When does performance loss justify replacement instead of continued operation?
- And how much faster does degradation progress under Nigerian environmental conditions?
This article breaks down the physics, the field data, and the economic threshold where degradation becomes a system-level financial decision.
PLAIN ENGLISH EXPLANATION
Panels lose power slowly, every year, permanently.
Think of it like a rechargeable battery that loses a small fraction of its maximum capacity each time you use it except with solar panels, the “use” is simply exposure to sunlight and heat. A panel rated at 400W today will produce around 372W in year 10 and 321W in year 25 even with perfect maintenance.
The key variable is how fast.
A tier-1 panel loses roughly 0.5% per year. A budget panel can lose 1–2% per year. That sounds similar. Over 25 years, it is the difference between 87% and 47% of original output measurable in kilowatt-hours and naira every single day.
How fast do solar panels degrade in Nigeria?
Solar panels in Nigeria degrade at 0.40–0.50% per year for tier-1 panels, while budget panels degrade at 1–2% per year. Heat, humidity, and dust can increase degradation by an additional 0.05–0.30% annually.
Over 25 years, this results in:
- Tier-1 panels: 86–88% output remaining
- Budget panels: 60–78% output remaining
QUICK COMPARISON TABLE
| Panel Type | Annual Degradation | Year 10 Output | Year 25 Output |
|---|---|---|---|
| Tier-1 Mono PERC | 0.40–0.50% | 95–96% | 86–88% |
| Mid-range Mono PERC | 0.50–0.60% | 94–95% | 83–86% |
| Polycrystalline | 0.60–0.70% | 93–94% | 80–83% |
| Budget Panels | 1.0–2.0% | 82–90% | 60–78% |
All Solar Panels Degrade The Question Is How Fast
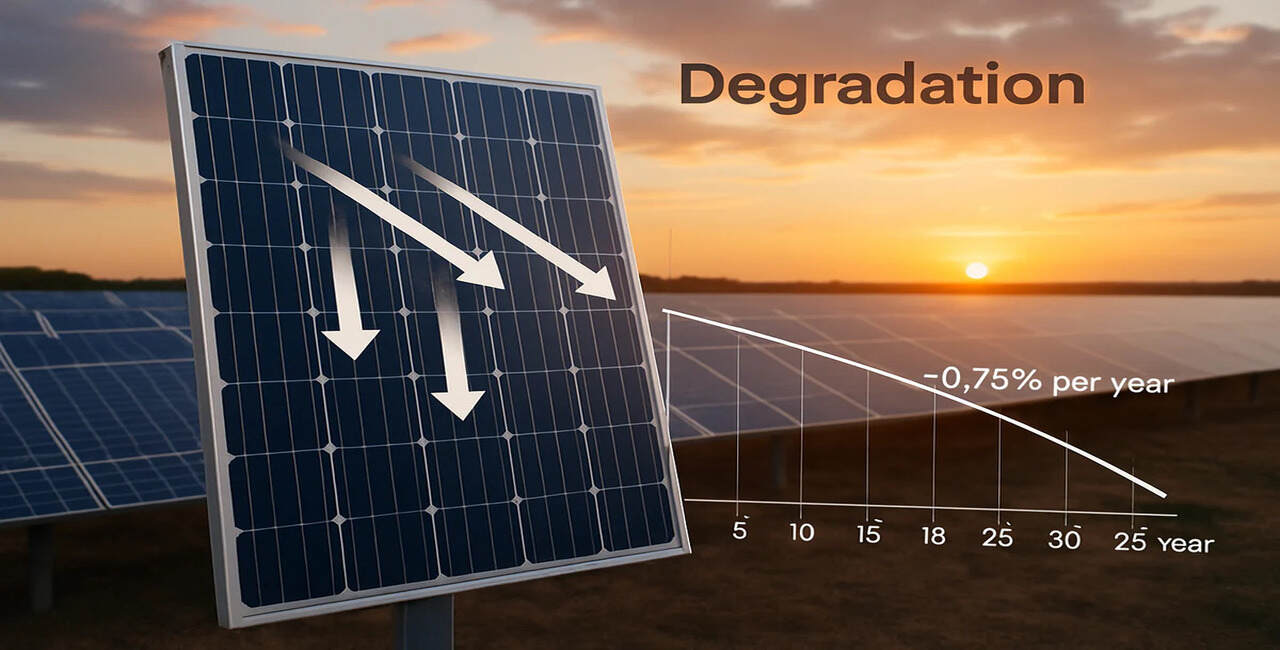
Solar panel degradation is not a fault. Every silicon solar cell loses efficiency over time as its crystalline structure responds to heat, UV, and mechanical stress. The manufacturer’s job is to slow this process. The buyer’s job is to choose a panel whose degradation rate fits their 10–25 year expectations.
| Panel Type | Year 1 LID | Annual Rate | Yr 10 Output | Yr 25 Output |
| Tier-1 mono PERC (LID/LeTID mitigation) | 0.5–1.0% | 0.40–0.50%/yr | 95–96% | 86–88% |
| Mid-range mono PERC (no LeTID mitigation) | 0.8–1.5% | 0.50–0.60%/yr | 94–95% | 83–86% |
| Standard polycrystalline | 1.5–2.5% | 0.60–0.70%/yr | 93–94% | 80–83% |
| Budget / unbranded (any type) | 2.0–4.0% | 1.0–2.0%/yr | 82–90% | 60–78% |
The compounding effect is what makes degradation rate so consequential. A 0.5% annual loss and a 1.5% annual loss look close in year 2. By year 15 they have diverged significantly and unlike a recoverable loss like soiling, degradation cannot be cleaned away.
What the 25-Year Warranty Actually Means
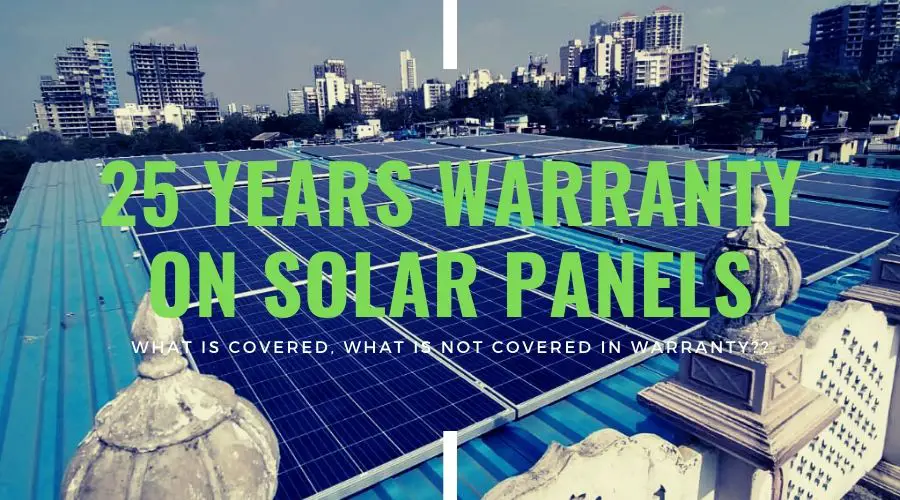
Most tier-1 manufacturers warrant 90% of rated output at year 10 and 80–82% at year 25. This is a performance floor guarantee the manufacturer is stating that their panel will degrade no faster than their stated curve. If it degrades faster, they will replace or compensate.
What the warranty does not cover: degradation within the stated curve, physical damage from improper installation, degradation from conditions outside the design specification, and any failure caused by third-party components or wiring errors.
Nigerian reality: Warranty claims for tier-1 panels sold in Nigeria are practically difficult. Most manufacturers require panels to be shipped to an authorised service centre, which typically is not in Nigeria. The 25-year warranty’s primary value is as a signal of manufacturer confidence in the product treat it as a quality indicator, not a practical claims mechanism.
Light Induced Degradation (LID) The Output You Lose in the First Week
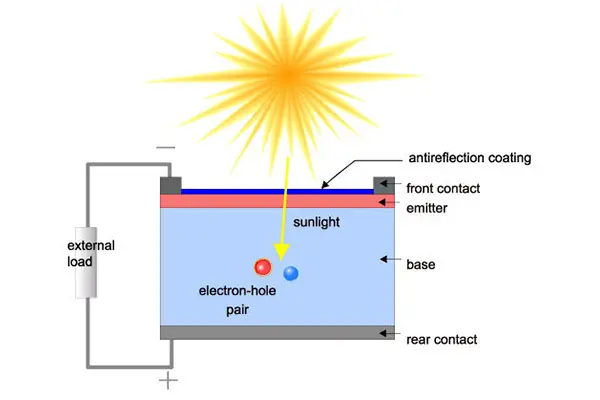
Light Induced Degradation (LID) is a one-time output loss that occurs in the first hours and days of sun exposure, caused by boron-oxygen defects activating in the silicon cell. It is not a manufacturing defect it is a material characteristic of boron-doped silicon.
For a 400W panel: a budget polycrystalline panel loses 2–4% in its first week, meaning you effectively receive a 384–392W panel from day one. A tier-1 mono PERC with LID mitigation loses 0.5–1.0% effectively a 396–398W panel from week one. That gap is permanent and compounding.
For a deeper comparison of how cell technology affects LID behaviour, see monocrystalline vs polycrystalline solar panels Nigeria.
What Causes Solar Panels to Degrade The Mechanisms That Matter in Nigeria
Generic degradation guides cover universal mechanisms. This section focuses on what matters specifically in Nigerian operating conditions because not all degradation mechanisms are equally relevant in a high-temperature, high-humidity, high-dust environment.
Thermal Cycling Daily Heat Stress
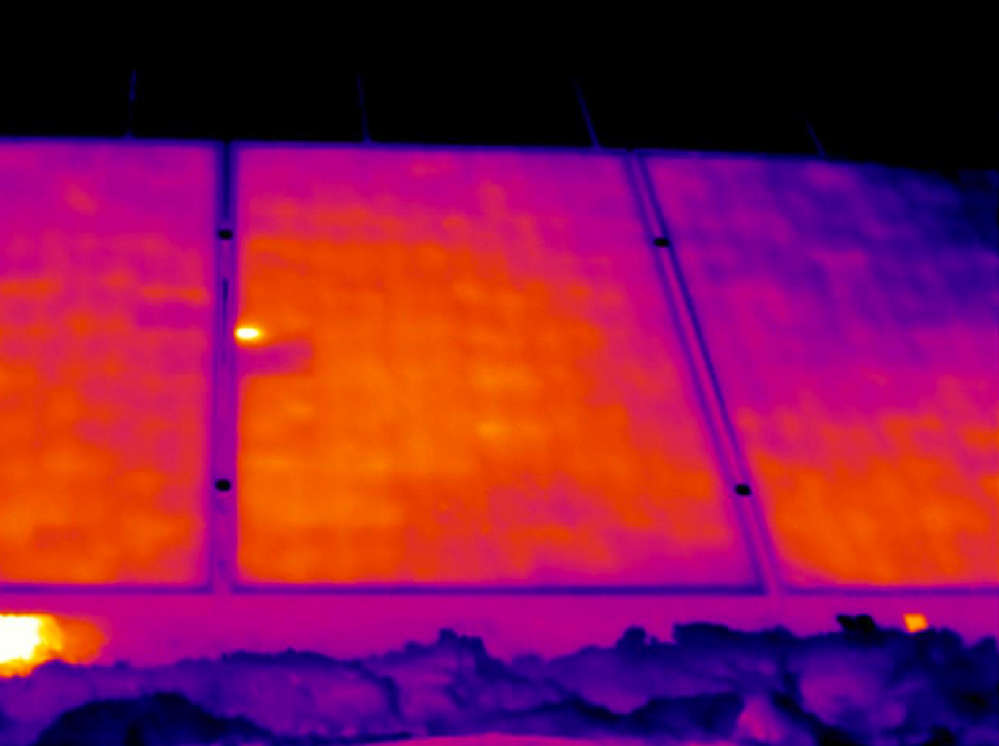
A Nigerian solar panel cycles between roughly 20°C at night and 65–75°C during peak sun hours a daily thermal swing of 45–55°C. Every material in the panel glass, encapsulant, cell, solder ribbon, aluminium frame expands and contracts at different rates through this cycle.
Over 25 years, that is approximately 9,000 thermal cycles. The primary consequence is solder ribbon fatigue: the thin copper ribbons connecting cells in series develop micro-cracks over thousands of cycles, increasing resistance and reducing current flow. This shows up as gradual output loss with no visible physical damage.
Panels installed with adequate ventilation gaps (5–10cm between panel back and roof surface) run 5–10°C cooler at peak, meaningfully reducing thermal cycling amplitude and extending solder ribbon life.
Light and Elevated Temperature Induced Degradation (LeTID)

Light and Elevated Temperature Induced Degradation (LeTID) is a degradation mechanism specific to PERC cell structures. It is triggered by the combination of illumination and elevated temperature exactly the conditions a Nigerian panel experiences during peak sun hours every day of the year.
LeTID can cause 1–3% additional degradation beyond LID in panels without LeTID mitigation. Tier-1 manufacturers have largely addressed it through cell passivation improvements. Budget panels using PERC cell structures without these mitigations may show LeTID-related degradation not reflected in their warranty.
Why this matters more in Nigeria than in Europe
LeTID manifests most strongly at cell temperatures consistently above 50°C. European panels rarely reach this temperature. Nigerian panels exceed it on most days of the year. LeTID is a Nigerian-relevant degradation risk, not just an abstract technical concern.
PID The Humidity and Voltage Problem

Potential Induced Degradation (PID) occurs when high voltage stress combines with moisture diffusing through the panel’s backsheet. In a 48V system the dominant architecture for serious Nigerian off-grid installations the voltage stress on individual cells is significant. In high-humidity environments like Lagos, Port Harcourt, and the Niger Delta, moisture diffuses through backsheets faster than in dry climates.
PID causes cell shunting individual cells develop leakage paths that reduce their output contribution to the string. Tier-1 panels carry PID resistance certification (tested per IEC 62804). Budget panels in high-humidity Nigerian locations without PID resistance are at meaningfully higher risk.
UV Degradation and Encapsulant Yellowing

Nigerian solar irradiance is intense and year-round. Prolonged UV exposure causes the EVA encapsulant layer to yellow over time, reducing light transmission to the cells and contributing gradual additional output loss of 0.1–0.2% per year. Quality panels use UV-stabilised EVA formulations that resist yellowing significantly better over a 25-year period.
For how encapsulant quality affects stated panel efficiency, see solar panel efficiency explained.
According to NREL’s degradation rate meta-analysis across 2,000+ PV systems, UV-related encapsulant degradation is a consistent secondary contributor to long-term output decline, with higher irradiance environments accelerating the mechanism directly applicable to Nigerian operating conditions.
Delamination: When Panels Physically Fail

Delamination is the separation of the encapsulant layer from the glass or backsheet. It creates an ingress path for moisture to reach the cells directly, causing corrosion of silver contact fingers, dissolution of the anti-reflective coating, and accelerated electrical degradation that compounds with every wet season.
Delamination is visible it appears as cloudy, whitened, or bubbled patches on the panel surface. It is more common in budget panels with lower-quality lamination, panels installed without ventilation gaps, and coastal installations with salt air exposure. A delaminated panel should be flagged for replacement regardless of its current measured output.
How Much Output You Lose Over Time Real Numbers
A 400Wp tier-1 mono PERC panel in Lagos (4.5 peak sun hours, 0.50%/yr degradation after 1% LID) compared to a 400Wp budget panel (2% LID, 1.5%/yr):
| Year | Tier-1 Output | Budget Output | Tier-1 Annual kWh | Budget Annual kWh |
| 1 | 396W | 392W | 651 kWh | 644 kWh |
| 5 | 388W | 357W | 638 kWh | 586 kWh |
| 10 | 372W | 304W | 611 kWh | 500 kWh |
| 15 | 354W | 258W | 582 kWh | 424 kWh |
| 20 | 337W | 220W | 554 kWh | 361 kWh |
| 25 | 321W | 187W | 527 kWh | 307 kWh |
The Financial Impact Over 25 Years
25-year cumulative energy single 400W panel, Lagos (4.5 PSH)

Tier-1 cumulative output = 14,676 kWh over 25 years

Budget panel cumulative = 11,120 kWh over 25 years

Difference = 3,556 kWh

At ₦1,200/kWh generator displacement value:

Per-panel value gap = ₦4,267,200 over 25 years

For a 6-panel array:

Array value gap = ₦25,603,200 tier-1 vs budget
The upfront price difference between a tier-1 and a budget panel is typically ₦15,000–₦40,000 per panel. The 25-year energy value gap is over ₦4 million per panel. For a full breakdown of what a 400W panel actually produces in Nigerian conditions, see 400W solar panel output in Nigeria.
3,556 kWh difference per panel over 25 years tier-1 vs budget
₦4.3M value of that energy gap at ₦1,200/kWh per panel
46.8% remaining output of a budget panel at year 25 worst case
How to Measure Solar Panel Degradation in Systems
Baseline Measurement Why Commissioning Data Matters
The most useful diagnostic data point you can have is commissioning-day output. A panel producing 345W on its first day in Nigerian conditions measured via MPPT power reading at solar noon on a clear day establishes the baseline that every future measurement is compared against.
Most Nigerian system owners never record this. From this point forward, every new installation should record: date, panel count and rated wattage, MPPT input power reading at solar noon on a clear day, ambient temperature, and battery state. A 5-minute record kept at commissioning is worth more than any monitoring system installed two years later.
Example check: if your panel measured 345W at commissioning and measures 305W five years later under similar conditions, that is an 11.6% decline. Expected decline at 0.50%/yr over 5 years is approximately 3.5%. An 11.6% measured decline warrants investigation soiling, shading, connection loss, or accelerated degradation.
Comparing Panels in the Same String

If one panel in a string is degrading significantly faster than its neighbours, it will pull down string output disproportionately through the series current effect. The diagnostic: under consistent irradiance conditions, measure the open-circuit voltage (Voc) and short-circuit current (Isc) of individual panels against each other and against the datasheet values.
A panel whose short-circuit current has dropped more than 10–15% below its neighbours under identical irradiance is a candidate for replacement or further investigation with thermal imaging. Thermal imaging can identify hotspot cells, delamination patches, and bypass diode failures that are invisible on a standard power output test.
Practical tip:
If you notice one section of your battery charging unusually slowly in the afternoon despite good sun and clean panels, measure each panel’s contribution individually by temporarily disconnecting strings. A significantly underperforming panel in a multi-string array can be identified this way without specialist equipment.
When Should You Replace Solar Panels?
Replacement Triggers
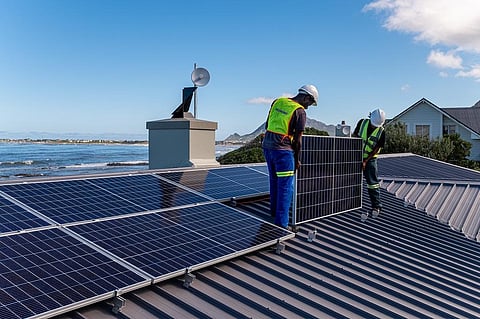
- Output below 80% of expected: Measured output falls more than 20% below the warranty degradation curve performance below what the panel should be producing at its current age
- Physical damage: Delamination, glass cracking, junction box failure, or significant discolouration these create moisture ingress pathways that worsen with time
- Confirmed hotspots: Thermal imaging shows consistent hotspot conditions in specific cell groups indicates cell-level damage that degrades performance and can become a fire risk
- Severe panel mismatch: One panel in a string showing more than 15% current deviation from its neighbours pulling down the entire string output daily
- Economic threshold: Replacement panel cost plus installation is less than the present value of additional energy generated over the remaining system life at current energy prices
Economic Decision Example
A 400W tier-1 panel installed in year 1 at ₦85,000 is now in year 12, producing 360W as expected. A budget panel in the same array is producing 280W 22% below its age-expected output. The replacement calculation:
Replacement decision degraded budget panel, year 12

Current actual output = 280W

Expected output at yr 12 = ~315W (budget, 1.2%/yr)

Deficit = 35W per panel

Daily energy loss = 35W × 5hrs = 0.175 kWh/day

Annual energy loss = 0.175 × 365 = 63.9 kWh/yr

Remaining 13 years of system life:

Cumulative loss = ~830 kWh (degrading further each year)

Value at ₦1,200/kWh = ₦996,000 in recoverable energy

Replacement panel cost ≈ ₦85,000 + ₦15,000 installation

Net gain from replacement ≈ ₦896,000 replace immediately
Use the off-grid solar sizing calculator to model replacement scenarios against your specific system’s energy needs and current panel performance.
Replace One Panel or the Full Array?
Replacing a single degraded panel in a string creates a mismatch problem. A new 400W panel has a higher Vmp and Isc than the aged panels beside it. The MPPT controller must find a compromise operating point the new panel is underutilised and the aged panels may be pushed harder than optimal.
The options, in order of preference:
- Replace the entire string simultaneously eliminates mismatch, gives matched performance across the string, maximises output recovery
- Run the replacement panel on a separate MPPT input requires a dual-MPPT controller, but allows both new and aged panels to operate at their individual optimal points
- Accept temporary mismatch, replace panel by panel as they reach threshold lowest immediate cost, but each replacement creates ongoing mismatch losses
The correct choice depends on how many panels have failed and the MPPT controller configuration. See the MPPT charge controller selection guide for dual-MPPT controller options suited to this scenario.
How to Slow Down Solar Panel Degradation
Degradation cannot be stopped but the rate is controllable. The factors below are in your direct control as a system owner or installer:
- Install with adequate ventilation gap (5–10cm minimum). Panels flush-mounted to a roof surface run 5–10°C hotter at peak, increasing thermal cycling amplitude, LeTID risk, and encapsulant aging rate. A properly ventilated installation costs nothing extra and meaningfully extends panel life.
- Clean panels on schedule. Abrasive harmattan dust particles grinding across the glass surface in wind events cause micro-scratches that scatter incident light permanently. Regular cleaning removes this abrasive layer before wind-driven grinding occurs.
- Set MPPT absorption voltage correctly. Chronic overcharge stresses cell chemistry. Correct absorption and float voltage settings per your battery specification prevent unnecessary electrical stress on both panels and battery.
- Choose tier-1 panels with LID, LeTID, and PID resistance certifications from the start. No maintenance practice compensates for a panel without these protections in Nigerian operating conditions.
See off-grid solar mistakes for the full list of specification errors that accelerate system degradation.
IEC 61215 qualification testing covers thermal cycling, humidity-freeze, and mechanical load resistance the baseline standard for panels sold in Nigeria. Beyond IEC 61215, look for IEC 62804 (PID resistance) and manufacturer documentation of LeTID mitigation. These are the specifications that matter most in the Nigerian operating environment.
Why Solar Panel Degradation Affects Battery Performance
Panel degradation and battery degradation are directly linked and most system owners only notice the battery problem, not the panel cause behind it.
As panels degrade, they deliver less current to the battery bank during the charging window. A system sized to fully charge a 200Ah battery bank using 2,400W of panels in year 1 may no longer complete a full charge by year 8 if panels have degraded 10% and the charging window has not otherwise changed.
A lithium battery that chronically ends the day at 80% state of charge instead of 95–100% develops cell imbalance over time. Lead-acid batteries suffer more directly: chronic undercharge leads to sulphation, which permanently reduces available capacity. The owner sees a battery that no longer holds charge and buys a new battery when the root cause was degraded panels delivering insufficient charging current.
For how to protect battery longevity from system-level causes including panel degradation, see how to increase lithium battery lifespan.
Final Verdict: Degradation Is Manageable, Not Inevitable
Tier-1 panels degrade slowly, predictably, and within a curve that makes 25-year system planning reliable. Budget panels degrade fast, often unpredictably, and compound into output deficits that affect every other component in the system especially the battery.
Nigerian conditions the heat, the humidity, the harmattan accelerate every degradation mechanism discussed in this article. But the difference between tier-1 and budget is larger than the difference between Nigerian and temperate conditions. Choosing the right panel at purchase is the most powerful degradation mitigation available.
Long-term thinking in solar is not about buying the cheapest panel that works today. It is about understanding that every panel you install will be producing power or not every day for the next 25 years. The compounding matters.
For a complete guide to panel selection, specification, and procurement in Nigeria, see the solar panels in Nigeria buyer’s guide.
Frequently Asked Questions
How fast do solar panels degrade in Nigeria?
Tier-1 mono PERC panels degrade at 0.40–0.50% per year in standard conditions. In Nigerian conditions, heat, humidity, and harmattan dust can add 0.05–0.30% to annual degradation depending on location and installation quality. Budget panels degrade at 1.0–2.0% per year even in standard conditions potentially faster under Nigerian thermal and humidity stress. The year-1 LID loss adds a one-time 0.5–4.0% on top of annual degradation.
Do solar panels lose efficiency every year?
Yes, every year without exception. Silicon solar cells lose a fraction of their efficiency permanently due to thermal cycling, UV exposure, solder fatigue, and encapsulant aging. There is no maintenance action that reverses this loss only design choices (ventilation, cleaning, tier-1 specifications) that slow it. A well-maintained tier-1 panel retains 86–88% of rated output at year 25. A poorly maintained budget panel may be at 50–60% by year 15.
When should solar panels be replaced?
Replace when measured output falls more than 20% below the expected degradation curve for the panel’s age, when physical damage (delamination, glass cracking, junction box failure) is present, when thermal imaging confirms hotspot cells, or when the economic calculation shows replacement cost is less than the present value of energy recovered. For most tier-1 panels in Nigerian conditions, output rarely warrants replacement before year 20. Budget panels may warrant replacement by year 12–15.
Do cheap panels degrade faster?
Yes, significantly. Budget panels degrade at 1.0–2.0% per year versus 0.40–0.50% for tier-1. They also carry higher year-1 LID losses (2–4% vs 0.5–1.0%) and often lack LeTID and PID resistance certification mechanisms that are particularly relevant in Nigerian high-temperature, high-humidity conditions. The compounding effect of these differences is 3,500+ kWh per panel over 25 years worth over ₦4 million at current energy values.
Can degradation be reversed?
No. Solar panel degradation is a permanent, irreversible change in cell and materials structure. Soiling losses can be recovered by cleaning. Shading losses can be recovered by clearing the obstruction. But thermal cycling damage to solder ribbons, UV yellowing of encapsulant, LeTID-related cell efficiency loss, and PID-related cell shunting are all permanent. This is why prevention tier-1 panel selection, ventilation, regular cleaning is more valuable than any corrective action.
Does heat increase panel degradation in Nigeria?
Yes, in multiple ways. Elevated cell temperatures increase the amplitude of thermal cycling, accelerating solder ribbon fatigue. They also create the conditions for LeTID in PERC cells a degradation mechanism that only manifests under combined heat and illumination. Nigerian panels operate at cell temperatures of 60–75°C during peak hours well above the thresholds at which both thermal cycling damage and LeTID occur. This makes LeTID-resistant tier-1 specifications more important in Nigeria than in temperate climates.
What is LeTID and does it affect Nigerian panels?
LeTID (Light and Elevated Temperature Induced Degradation) is a degradation mechanism in PERC solar cells triggered by combined illumination and high temperature typically above 50°C cell temperature. Nigerian panels exceed this threshold most days of the year. LeTID can cause 1–3% additional output loss in panels without mitigation. Tier-1 manufacturers address LeTID through cell passivation improvements. Budget PERC panels without these mitigations may show LeTID-related degradation not covered by warranty.
Should I replace one degraded panel or the whole array?
Replacing a single panel in an aged string creates a mismatch: the new panel has a different operating point from the older panels beside it. Ideally, replace the entire string simultaneously. If that is not feasible, run the replacement panel on a separate MPPT input to allow it to track its own optimum. The MPPT controller must support multiple independent inputs for this approach. A single new panel mixed into an aged series string will underperform relative to its rated output.

I am Engr. Ubokobong Ekpenyong, a solar specialist and lithium battery systems engineer with over five years of hands-on experience designing, assembling, and commissioning off-grid solar and energy storage systems. My work focuses on lithium battery pack architecture, BMS configuration, and system reliability in off-grid and high-demand environments.