Introduction
Designing an off-grid power system is the difference between buying components and engineering a solution. You’re not just connecting batteries to solar panels, you’re building infrastructure that has to predict your energy needs, survive equipment failures, handle week-long storms, and operate safely for a decade or more. There’s no utility company acting as your backup battery. You are the power company.
I’ve designed systems from 2kW cabin setups to 25kW homesteads, and the distinction between a functioning system and an expensive failure comes down to proper engineering. Undersized battery banks die in two years instead of ten. Mismatched voltages create inefficiencies that cost thousands in lost production. Bypassed safety systems turn lithium banks into fire hazards. These aren’t theoretical problems, I’ve troubleshot all of them.
This guide walks through the complete design process for lithium battery-based off-grid systems. We’ll cover the actual calculations for sizing your battery bank, selecting system voltage, understanding why your Battery Management System is non-negotiable, choosing between MPPT and PWM charge controllers, and ensuring everything meets electrical codes. You’ll see worked examples with real numbers, not just formulas.
By the end, you’ll understand not just what components to specify, but why each decision matters and how to avoid the expensive mistakes I see repeatedly. This is practitioner-level engineering, not a shopping list. If you want to design a system that works reliably for its intended lifespan, this is where we start.
Why Lithium (LiFePO4) Has Become the Standard

LiFePO4 replaced lead-acid in off-grid systems for one reason: the numbers are dramatically better. I specify lithium for every new installation because the performance difference is measurable and significant.
Cycle life tells the story. A quality LiFePO4 bank gives you 3,000 to 5,000 cycles at 80% depth of discharge. Lead-acid tops out around 500 to 1,000 cycles at 50% DoD. Run those numbers over ten years and lithium delivers six times the usable energy over its lifespan. The higher upfront cost disappears when you account for replacement cycles.
Usable capacity matters more than nameplate rating. LiFePO4 allows 80% to 100% depth of discharge without damage. Lead-acid requires you to stay above 50% or you accelerate sulfation and plate degradation. A 10kWh lithium bank gives you 8 to 10kWh of usable energy. A 10kWh lead-acid bank gives you 5kWh. You need twice the lead-acid capacity to match lithium performance.
Efficiency is quantifiable. LiFePO4 operates at 95% to 98% round-trip efficiency. Lead-acid sits around 80% to 85%. On a 10kWh daily cycling system, that efficiency difference costs you 1 to 1.5kWh every single day in heat loss and chemical inefficiency.
The practical advantages stack up quickly: zero maintenance, one-third the physical footprint, significantly lighter weight, and better performance across temperature extremes. LiFePO4 prices dropped to $115 per kWh in 2024, making the cost gap between lithium and quality lead-acid narrow enough that the performance benefits justify the difference on nearly every installation I design.
Understanding System Architecture Fundamentals
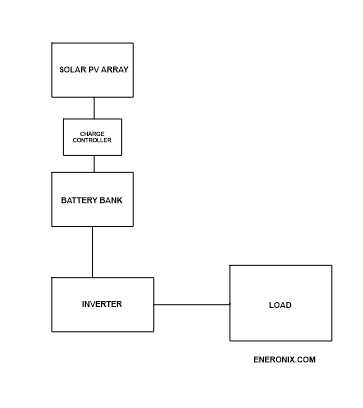
Every off-grid system has four core components that must work together as an integrated unit. I’ll walk through each one and how they interact, because understanding the energy flow prevents the mismatched component problems I troubleshoot constantly.
The battery bank stores energy. This is your buffer between production and consumption. Solar panels generate power during the day, your loads consume power around the clock. The battery bridges that gap. In a LiFePO4 system, you’re storing DC power at your system voltage (12V, 24V, or 48V).
The Battery Management System sits between your battery cells and everything else. The BMS monitors every cell’s voltage and temperature, enforces charging and discharging limits, and cuts power if anything exceeds safe parameters. This is your primary safety device. I’ve seen installers try to bypass BMS protections to squeeze out more capacity. Those systems fail expensively.
The charge controller manages power flow from your solar array into the battery bank. MPPT or PWM controllers regulate voltage and current to match what your batteries need at any given state of charge. The controller prevents overcharging, optimizes power harvest from your panels, and adapts to varying sunlight conditions throughout the day.
The inverter converts DC power from your battery bank into AC power for your loads. Most household appliances run on 120V or 240V AC. The inverter transforms your 12V, 24V, or 48V DC into usable AC power at the correct voltage and frequency.
These four components form a closed loop. Solar charges batteries through the controller. Batteries supply the inverter. The inverter powers your loads. The BMS protects everything. Break the chain anywhere and the system fails.
Step 1: Calculating Your Energy Requirements
Energy auditing is where most design errors start. I’ve seen people guess at their consumption, undersize their system by 40%, and wonder why their batteries are dead by year three. You need actual numbers.
Start with a complete appliance inventory. List everything that draws power with its wattage and daily runtime. Refrigerator: 150W running 8 hours per day equals 1,200Wh. LED lighting: 60W total running 5 hours equals 300Wh. Laptop: 65W for 6 hours equals 390Wh. Water pump: 800W for 0.5 hours equals 400Wh. Go through every device.
Sum your total watt-hours per day. For a typical small cabin, this often lands between 3,000Wh and 8,000Wh daily. A full-time residence runs 8,000Wh to 15,000Wh depending on climate control loads. I pull actual consumption data from utility bills when available because people consistently underestimate phantom loads, charging devices, and seasonal variations.
Peak loads matter separately from total energy. Your inverter must handle the maximum simultaneous draw. If your well pump (800W), refrigerator (150W), and microwave (1,200W) all run at once, you need inverter capacity for 2,150W continuous, plus surge margin for motor starting currents. I’ve seen 3,000W average daily consumption require a 5,000W inverter because of poor load distribution.
Add 15% to 20% safety margin to your final number. System losses are real. Inverter inefficiency, wire resistance, temperature effects, and battery self-discharge consume power. If your audit shows 8,000Wh daily consumption, design for 9,200Wh to 9,600Wh. This buffer accounts for the gap between theoretical calculations and actual field performance.
Seasonal variation requires attention in four-season climates. Winter heating loads or summer air conditioning can double your baseline consumption for months at a time.
Step 2: Selecting Your System Voltage
System voltage is not a preference decision. It’s an engineering calculation based on power levels and current flow. Get this wrong and you’ll be running undersized wire that heats up, wastes energy, and creates fire hazards.
The power equation is simple: P = V × I. To deliver 1,200W at 12V requires 100 amps of current. That same 1,200W at 48V is 25 amps. Current determines wire size, and wire size determines cost and efficiency. Pushing 100 amps requires 2/0 AWG copper. 25 amps runs safely on 10 AWG. The price difference on a 20-foot run is $200 versus $30.
I specify 48V for any whole-home system above 3kW daily consumption. The lower current reduces resistive losses in every wire run, connection point, and fuse. On a 10kW system, the efficiency gain from 48V over 12V is 3% to 5%. That’s 300W to 500W per day you’re not converting to heat in your cables.
24V works for mid-sized applications between 1kW and 3kW daily. Small cabins, workshops, and larger RV systems fit here. You get reasonable wire sizing without the complexity of higher voltage component sourcing.
12V is for compact mobile applications only. Van builds, small RVs, boats under 1kW total capacity. Above that threshold, the current requirements make 12V impractical. I see people try to run 5kW systems on 12V and they end up with 400-amp battery cables that cost more than upgrading to 48V would have.
Critical rule: every component must match your system voltage. Your battery bank, charge controller, and inverter all operate at the same voltage. Mixing voltages requires DC-to-DC conversion, which adds cost, complexity, and another efficiency loss point. Choose your voltage first, then spec every component to match.
Step 3: Battery Bank Sizing
Battery sizing determines whether your system delivers its rated capacity for ten years or fails in three. The calculation is straightforward, but most installers skip critical factors and end up with undersized banks that cycle too deeply, age faster, and shut down prematurely under load.
I size batteries using a four-step process that accounts for energy demand, autonomy requirements, usable depth of discharge, and real-world system losses. Miss any of these and your capacity calculations are fiction.
Days of Autonomy:
This is how long your battery must sustain loads without solar input. Off-grid homes typically need 2 to 3 days to handle cloudy weather without diesel generator backup. Remote locations with extended weather events require 5 to 7 days. Grid-tied systems with battery backup can operate on 1 to 2 days since the grid or generator fills gaps. Climate drives this decision. Equatorial regions with predictable sun need less autonomy than temperate zones with week-long storms.
Depth of Discharge for LiFePO4:
LiFePO4 allows 80% to 90% usable depth of discharge without damage. I design to 80% DoD because it doubles cycle life compared to 90% DoD. Running a battery to 90% daily gives you 3,000 cycles. Limiting to 80% pushes that past 5,000 cycles. The math is simple: oversize the bank by 12.5% and gain two extra years of service life. Read more about this in why 100% maximum usable capacity kills lithium batteries.
System Efficiency Losses:
Inverters operate at 85% to 95% efficiency. MPPT controllers add another 5% to 7% loss. Wiring resistance, temperature effects, and battery self-discharge consume more. Overall system efficiency sits around 85%. If you calculate a 20-kWh requirement and ignore losses, you are undersizing by 15%. The real requirement is 23.5 kWh.
Complete Sizing Formula: Daily consumption multiplied by days of autonomy gives base capacity. Divide by 0.80 DoD to get required battery capacity. Divide by 0.85 system efficiency for final sizing. Example: 10 kWh daily, 2 days autonomy. (10 kWh × 2) ÷ 0.80 = 25 kWh ÷ 0.85 = 29.4 kWh total battery capacity needed. At 48V nominal, that is 29,400 Wh ÷ 51.2V = 574 Ah. Round up to 600 Ah for margin.
Example 1:
Let me work through a practical scenario for a residential off-grid solar system.
Scenario: Small Family Home
Daily Energy Consumption:
- LED lighting (6 bulbs × 10W × 5 hours) = 300 Wh
- Refrigerator (150W × 24 hours × 0.33 duty cycle) = 1,200 Wh
- TV and entertainment (200W × 4 hours) = 800 Wh
- Laptop charging (65W × 6 hours) = 390 Wh
- Phone charging (4 phones × 10W × 2 hours) = 80 Wh
- Ceiling fans (3 fans × 75W × 8 hours) = 1,800 Wh
- Water pump (750W × 0.5 hours) = 375 Wh
- Microwave (1000W × 0.25 hours) = 250 Wh
- Washing machine (500W × 1 hour, 3x/week) = 214 Wh daily average
Total Daily Consumption: 5,409 Wh ≈ 5.4 kWh
Battery Sizing Calculation
Step 1: Base Capacity (with autonomy)
- Daily consumption: 5.4 kWh
- Days of autonomy: 3 days (for cloudy weather)
- Base capacity = 5.4 kWh × 3 = 16.2 kWh
Step 2: Account for Depth of Discharge (DoD)
- Using 80% DoD for lithium batteries
- Required capacity = 16.2 kWh ÷ 0.80 = 20.25 kWh
Step 3: Account for System Efficiency
- System efficiency: 85% (inverter losses, wiring losses)
- Final capacity = 20.25 kWh ÷ 0.85 = 23.82 kWh
Step 4: Convert to Amp-Hours at 48V System
- Nominal voltage: 48V (actual: 51.2V for LiFePO4)
- Amp-hours = 23,820 Wh ÷ 51.2V = 465 Ah
Step 5: Add Safety Margin
- Round up to standard size: 500 Ah @ 48V
- Final battery capacity: 25.6 kWh
Recommended Battery Configuration
Option 1: Single 48V Battery Bank
- 1 × 500Ah 48V LiFePO4 battery bank
- Total capacity: 25.6 kWh
Option 2: Modular Configuration
- 4 × 125Ah 48V batteries in parallel
- Or 2 × 250Ah 48V batteries in parallel
- Easier to install and replace individual modules
System Summary
- Daily consumption: 5.4 kWh
- Days of autonomy: 3 days
- Usable capacity: 20.5 kWh (80% of 25.6 kWh)
- Battery bank: 500Ah @ 48V = 25.6 kWh
- Solar array needed: ~2.7 kW (to recharge fully in one day)
- Inverter size: 3-5 kW (for surge capacity)
This sizing provides adequate backup power for 3 cloudy days while maintaining healthy battery depth of discharge for long lifespan.
Example 2:
Let me work through a substantial commercial facility to demonstrate high-voltage benefits.
Scenario: Small Commercial Building / Mini-Grid
Daily Energy Consumption:
- HVAC system (15 kW × 12 hours × 0.6 duty cycle) = 108,000 Wh
- Industrial refrigeration (8 kW × 24 hours × 0.4 duty cycle) = 76,800 Wh
- Lighting (200 fixtures × 40W × 10 hours) = 80,000 Wh
- Office equipment (50 computers × 150W × 8 hours) = 60,000 Wh
- Production machinery (25 kW × 8 hours) = 200,000 Wh
- Water pumps and auxiliary (5 kW × 6 hours) = 30,000 Wh
- Security and surveillance (2 kW × 24 hours) = 48,000 Wh
- EV charging stations (22 kW × 4 hours) = 88,000 Wh
- Kitchen/break room (8 kW × 3 hours) = 24,000 Wh
Total Daily Consumption: 714,800 Wh ≈ 715 kWh
Battery Sizing Calculation
Step 1: Base Capacity (with autonomy)
- Daily consumption: 715 kWh
- Days of autonomy: 2 days (commercial backup requirement)
- Base capacity = 715 kWh × 2 = 1,430 kWh
Step 2: Account for Depth of Discharge
- Using 80% DoD for LiFePO4
- Required capacity = 1,430 kWh ÷ 0.80 = 1,787.5 kWh
Step 3: Account for System Efficiency
- System efficiency: 85%
- Final capacity = 1,787.5 kWh ÷ 0.85 = 2,103 kWh
Round up to: 2,100 kWh total battery capacity
Voltage Comparison Analysis
Now let’s see how current requirements change with different system voltages:
Option 1: 48V System (Low Voltage)
- Voltage: 51.2V (48V nominal LiFePO4)
- Capacity needed: 2,100,000 Wh ÷ 51.2V = 41,016 Ah
- Peak discharge current (for 150 kW load): 150,000W ÷ 51.2V = 2,930A
- Continuous current (30 kW average): 30,000W ÷ 51.2V = 586 A
- Cable size needed: ~4/0 AWG or larger (extremely thick!)
- Cable cost: Very High (massive copper conductors)
- Problem: This is impractical and dangerous!
Option 2: 120V System (Medium-Low Voltage)
- Voltage: 120V (nominal)
- Capacity needed: 2,100,000 Wh ÷ 120V = 17,500 Ah
- Peak discharge current: 150,000W ÷ 120V = 1,250 A
- Continuous current: 30,000W ÷ 120V = 250 A
- Cable size: ~250 kcmil copper
- Current reduction: 57% less than 48V
- Still quite high current for large cables
Option 3: 384V System (Medium Voltage)
- Voltage: 384V (nominal, 8S × 48V modules)
- Capacity needed: 2,100,000 Wh ÷ 384V = 5,469 Ah
- Peak discharge current: 150,000W ÷ 384V = 391 A
- Continuous current: 30,000W ÷ 384V = 78 A
- Cable size: ~3/0 AWG
- Current reduction: 87% less than 48V
- Much more reasonable!
Option 4: 800V System (High Voltage – Modern Standard)
- Voltage: 819.2V (16S × 51.2V modules)
- Capacity needed: 2,100,000 Wh ÷ 819.2V = 2,564 Ah
- Peak discharge current: 150,000W ÷ 819.2V = 183 A
- Continuous current: 30,000W ÷ 819.2V = 37 A
- Cable size: ~1/0 AWG or 2 AWG
- Current reduction: 94% less than 48V
- Optimal balance for large systems
Option 5: 1500V System (Ultra-High Voltage – Utility Scale)
- Voltage: 1,536V (30S × 51.2V modules)
- Capacity needed: 2,100,000 Wh ÷ 1,536V = 1,367 Ah
- Peak discharge current: 150,000W ÷ 1,536V = 98 A
- Continuous current: 30,000W ÷ 1,536V = 20 A
- Cable size: 6 AWG or 8 AWG
- Current reduction: 97% less than 48V
- Highest efficiency, minimal losses
- Requires specialized high-voltage equipment
Current & Loss Comparison Table
| System Voltage | Capacity (Ah) | Peak Current | Continuous Current | Cable Size | I²R Losses (relative) |
|---|---|---|---|---|---|
| 48V | 41,016 Ah | 2,930 A | 586 A | 4/0+ AWG | 100% (baseline) |
| 120V | 17,500 Ah | 1,250 A | 250 A | 250 kcmil | 43% |
| 384V | 5,469 Ah | 391 A | 78 A | 3/0 AWG | 17% |
| 800V | 2,564 Ah | 183 A | 37 A | 1/0 AWG | 6.2% |
| 1500V | 1,367 Ah | 98 A | 20 A | 6 AWG | 1.8% |
Real-World Benefits of High Voltage
Power Loss Calculation Example
Using 50 feet of cable run at continuous 30 kW load:
48V System:
- Current: 586 A
- Cable resistance (4/0 AWG, 50 ft): ~0.0025 Ω
- Power loss: I²R = 586² × 0.0025 = 858 watts lost
- Efficiency: 96.3%
800V System:
- Current: 37 A
- Cable resistance (1/0 AWG, 50 ft): ~0.006 Ω
- Power loss: I²R = 37² × 0.006 = 8.2 watts lost
- Efficiency: 99.97%
Savings: 850 watts = $74/month @ $0.12/kWh (24/7 operation)
Recommended Configuration: 800V System
Final Design:
- Total capacity: 2,100 kWh
- System voltage: 800V nominal (819.2V actual)
- Configuration: 2,564 Ah @ 800V
- Modules: 16S × 4P configuration (64 total 200Ah modules)
- Peak power capability: 150 kW
- Continuous power: 50 kW
Component Sizing:
- Inverter: 150 kW (800V DC input, 480V 3-phase AC output)
- Bus bars: 200A rated (instead of 3,000A!)
- Cables: 1/0 AWG copper (instead of 4/0 × 4 parallel!)
- Circuit breakers: 250A DC rated
- BMS: High-voltage rated (1000V capable)
Cost Comparison:
- 48V cabling cost: ~$45,000 (massive conductors)
- 800V cabling cost: ~$8,000 (reasonable size)
- Savings: $37,000 just on copper!
Key Takeaways
- Current drops dramatically with higher voltage (P = V × I)
- Cable losses scale with I² (square of current)
- 800V is the sweet spot for commercial systems (balance of safety, cost, efficiency)
- 1500V for utility-scale (MW range)
- Never use 48V for systems above ~10 kW continuous power
The physics are clear: Higher voltage = Lower current = Lower losses = Smaller cables = Lower cost
The difference between a 400 Ah bank and a properly sized 600 Ah bank is three additional years of reliable operation before replacement.
Step 4: Battery Management System (BMS)
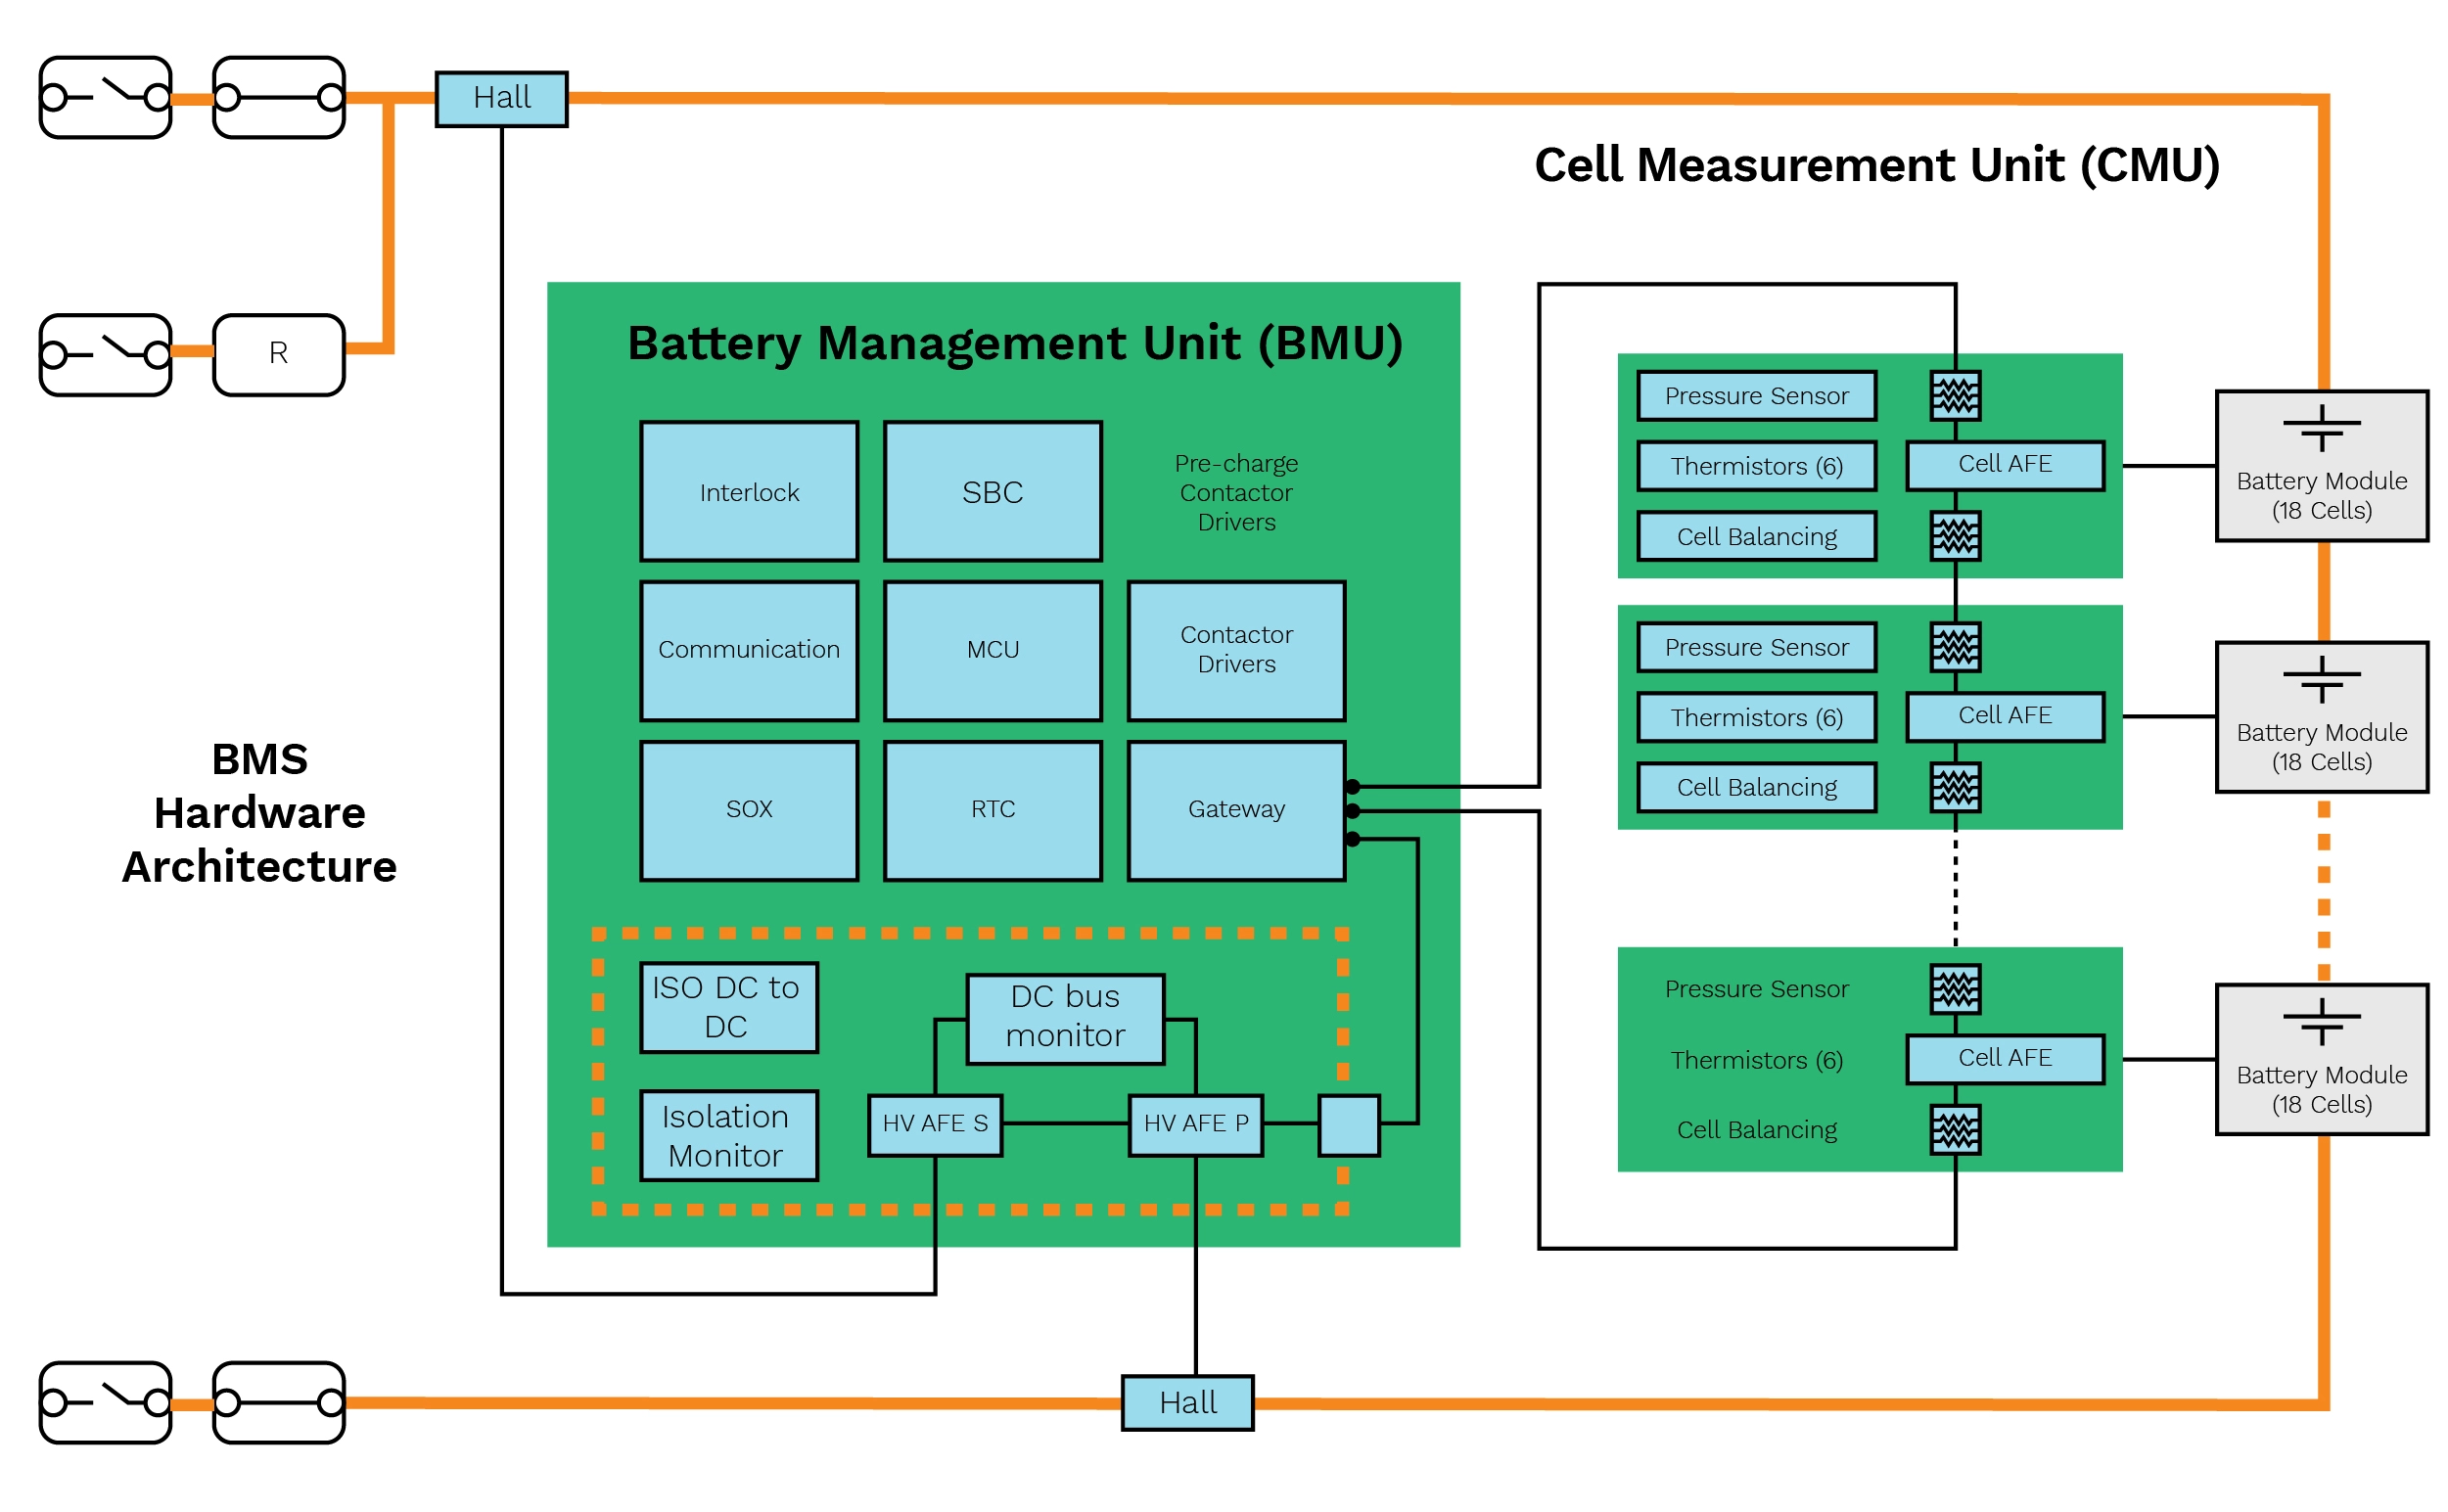
The BMS is not a feature. It is the control authority that determines whether your lithium bank operates safely or becomes a liability. Every protection function, every voltage limit, and every thermal cutoff exists because lithium chemistry has no tolerance for operating outside its electrochemical boundaries.
I have seen premium LiFePO4 cells destroyed by inadequate BMS protection. I have also seen budget cells deliver years of service because the BMS enforced strict limits. The BMS quality matters more than cell brand in determining real-world longevity.
Six Essential Protection Functions:
Over-voltage protection prevents electrolyte breakdown during charging. Under-voltage protection stops discharge before internal damage occurs. Over-current protection limits charge and discharge rates to what the cells can handle. Temperature monitoring enforces safe operating range and prevents thermal runaway. Short-circuit protection cuts current in milliseconds when fault resistance drops. Cell balancing corrects voltage drift between series-connected cells. Every function is non-negotiable. Bypass one and you have introduced a failure mode.
Critical BMS Settings for LiFePO4:
Cell voltage range is 2.5V to 3.65V. Charge cutoff should be 3.55V to 3.60V per cell to maximize cycle life. Discharge cutoff should be 2.8V to 3.0V per cell depending on load profile. Never charge below 0°C because lithium plating causes permanent capacity loss. These limits are not suggestions. They are the boundaries between ten-year service life and three-year failure. More detail on proper BMS configuration is covered in 6 dangers of setting BMS cutoffs from datasheets alone.
Modern BMS Communication:
Quality BMS units communicate via CAN bus or RS485 with your inverter. This closed-loop communication allows the BMS to command charge current, discharge limits, and controlled shutdowns instead of hard cutoffs. A BMS that cannot communicate forces the inverter into blind operation with fixed limits. Understanding how BMS and inverter communicate prevents most compatibility failures I troubleshoot.
The BMS is your primary safety device. Invest here or pay later in destroyed cells and system downtime.
Step 5: Charge Controller Selection

Charge controller selection is not about budget. It is about how much solar energy you capture over the system’s lifetime. The efficiency difference between MPPT and PWM controllers compounds daily for years, making the upfront cost difference irrelevant in any system above 500W.
I specify MPPT for every installation I design because the performance gap is measurable and significant. PWM controllers belong in the past with lead-acid batteries and small portable systems.
MPPT Efficiency and Advantages:
MPPT controllers operate at 95% to 99% efficiency and continuously track the maximum power point of your solar array. This harvests 10% to 30% more energy than PWM depending on temperature, voltage mismatch, and array configuration. Cold climates see the largest gains because panel voltage rises while battery voltage stays constant. MPPT adapts automatically. MPPT also allows series panel wiring which reduces current, allows thinner cable, and cuts installation cost. In low-light and partial shade conditions, MPPT extracts usable power where PWM output collapses.
PWM Limitations:
PWM controllers pull panel voltage down to battery voltage and operate at 75% to 80% efficiency. They only make sense in systems under 200W where array voltage closely matches battery voltage. Above that threshold, the lost harvest over five years costs more than the controller price difference. I have replaced dozens of PWM installations where users complained about poor performance. Switching to MPPT with the same panels increased daily yield by 20% to 35%.
MPPT Sizing Calculation:
Controller amp rating must exceed panel output with safety margin. Formula: (Panel Wattage ÷ System Voltage) × 1.25 safety factor. Example: 1,500W array on 48V system equals (1,500W ÷ 48V) × 1.25 = 39A minimum rating. Spec a 40A or 50A controller. Undersizing creates thermal stress and shortened lifespan. For more on charging profiles and MPPT configuration, understanding the difference from lead-acid systems is critical.
MPPT controllers cost 50% more than PWM but deliver 20% more energy every single day. That difference pays back in under two years on any serious installation.
Step 6: Inverter Selection and Sizing

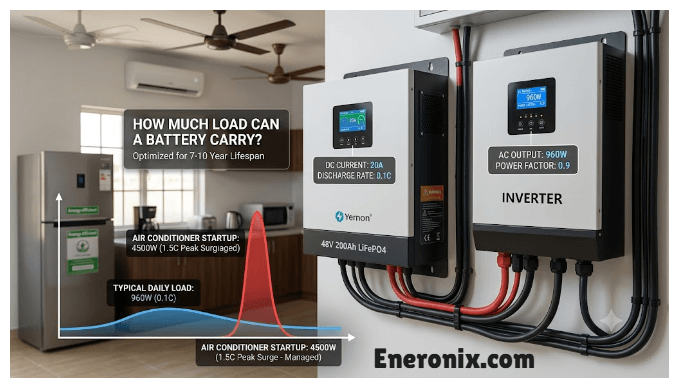
Inverter selection determines whether your battery bank can actually deliver its stored energy when loads demand it. Undersized inverters shut down during surge events. Oversized inverters waste money on capacity you will never use. Proper sizing requires understanding both continuous ratings and surge capacity.
I size inverters based on peak simultaneous loads plus surge margin, not average consumption. A system that averages 2kW throughout the day may require a 5kW inverter because of motor starting currents and simultaneous appliance operation.
Pure Sine Wave is Mandatory:
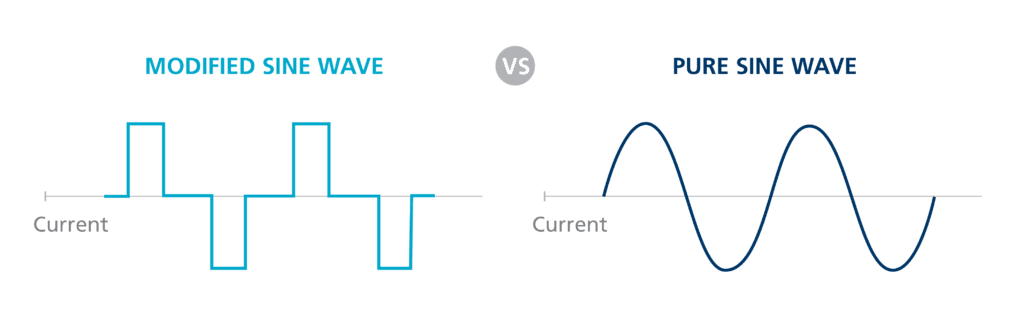
Modified sine wave inverters damage sensitive electronics, cause motor overheating, and create interference in audio equipment. Every modern appliance expects clean AC power. Pure sine wave is not optional. I have never specified a modified sine wave inverter in fifteen years of system design.
Continuous vs Surge Ratings:
Continuous rating is what the inverter can deliver indefinitely. Surge rating is short-duration capacity for motor starting currents. Refrigerators draw 3 to 5 times continuous power for 2 to 5 seconds during compressor startup. Well pumps draw 3 to 7 times continuous. Power tools spike 2 to 3 times. Your inverter must handle these peaks without shutdown. Calculate peak simultaneous loads, add dominant surge requirement, then add 20% to 25% safety margin.
Sizing Example:
Home runs 1,500W baseload (lights, refrigerator, fans). Well pump adds 800W continuous but 4,800W surge for 3 seconds. Microwave adds 1,200W. Peak simultaneous load is 3,500W. Surge requirement is 4,800W. Minimum inverter spec is 5kW continuous with 6kW to 8kW surge capacity. A 3kW inverter would shut down every time the pump starts even though average load is under 2kW.
Communication Integration:
Modern inverters communicate with BMS via CAN or RS485 to receive dynamic charge limits and state of charge data. This prevents overcharge, coordinates with battery protection systems, and enables controlled responses instead of hard cutoffs.
Inverter sizing is not guesswork. It is peak load analysis with surge margin and proper battery integration.
Step 7: Component Integration
Component integration is where theoretical system design meets physical reality. Every component must match system voltage, communicate effectively, and operate within compatible electrical parameters. Integration failures cause more field problems than component defects.
I verify compatibility across four critical parameters before specifying any system: voltage matching, communication protocols, current capacity, and protection coordination.
Voltage Matching is Non-Negotiable:
Battery bank, charge controller, and inverter must all operate at identical system voltage. A 48V battery bank requires a 48V MPPT controller and 48V inverter input. Mixing voltages requires DC-DC conversion which adds cost, complexity, and another 5% to 10% efficiency loss. I see installers attempt 24V battery with 48V inverter conversions. These systems fail within months from converter thermal stress.
BMS to Inverter Communication:
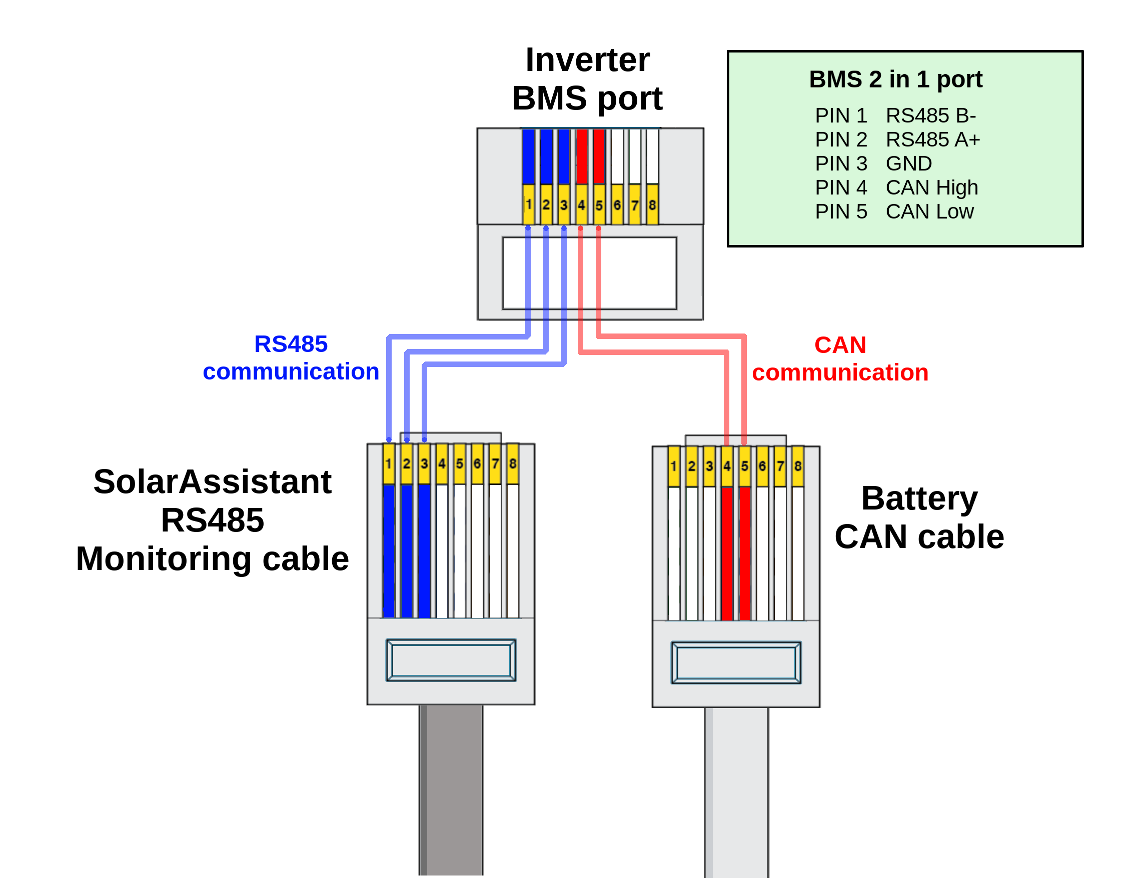
Closed-loop communication via CAN bus or RS485 allows the BMS to actively control inverter behavior. The BMS transmits state of charge, charge voltage limits, charge current limits, and discharge current limits in real time. The inverter adjusts its operation to respect these boundaries. Without communication, the inverter operates blind with fixed charge parameters that cannot adapt to battery state. This causes premature BMS cutoffs, communication failures, and degraded cycle life. Understanding CVL, CCL, and DCL dynamic limits is essential for proper integration.
MPPT Lithium Charging Profiles:

Your charge controller must support lithium-specific charging profiles. Lead-acid profiles use bulk, absorption, and float stages that damage lithium batteries over time. Lithium requires constant current/constant voltage charging with no float stage. Controllers without lithium profiles will slowly degrade your battery bank.
Current Capacity Coordination:
Every component in the power path must handle system current safely. Bus bars, fuses, wire gauge, and terminals all must be rated for continuous current plus surge margin. One undersized connection creates a thermal failure point.
Integration is engineering discipline. Match voltages, verify communication, size current paths, and coordinate protection. Skip steps and the system fails regardless of component quality.
Step 8: Wiring & Safety
Wiring determines whether your battery bank operates at rated efficiency or wastes energy as heat in undersized conductors. Every connection point, every cable run, and every fuse placement affects system performance and safety. Poor wiring kills more systems than bad components.
I calculate wire gauge based on ampacity and voltage drop, then verify every connection can handle fault current without becoming a fire hazard.
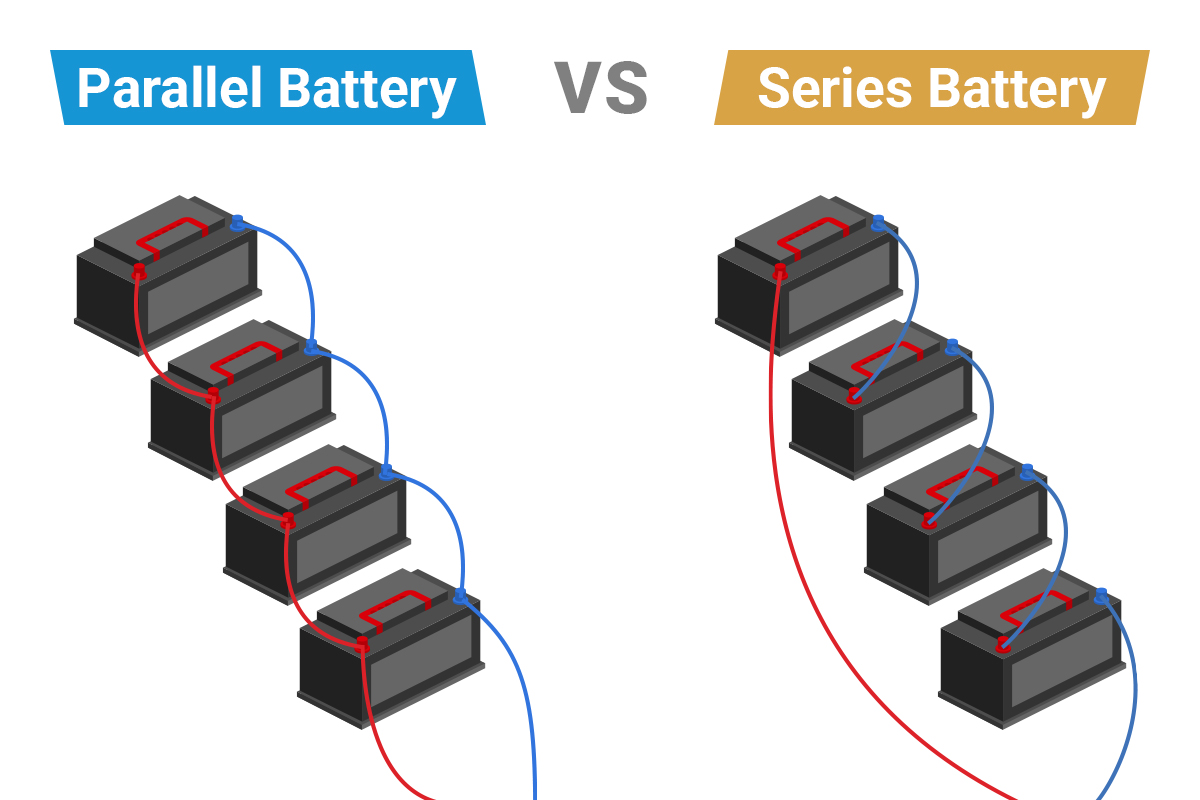
Series vs Parallel Battery Configuration:
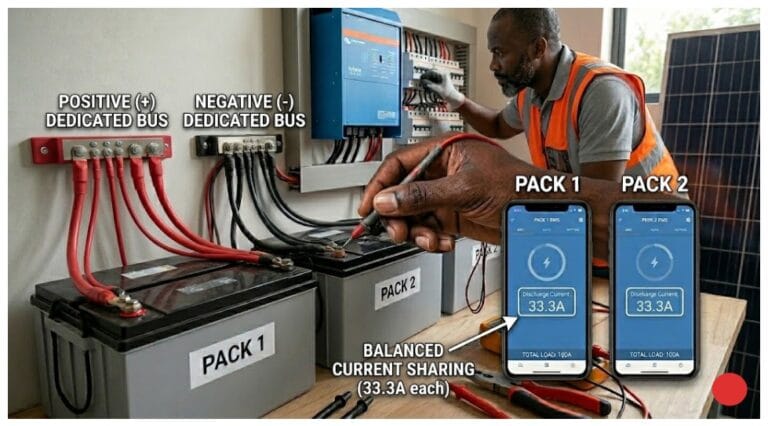
Series connection increases voltage by connecting positive terminal to next cell’s negative terminal. Sixteen 3.2V LiFePO4 cells in series create 51.2V nominal. Current remains identical to single cell capacity. Parallel connection increases capacity by joining all positive terminals together and all negative terminals together. Four 100Ah cells in parallel create 400Ah at same voltage. Critical rule: never mix battery ages, brands, or capacities in same bank. Mismatched cells cause uneven current sharing and accelerated degradation. Pre-balance all batteries to same state of charge before first connection.
Wire Gauge Selection:
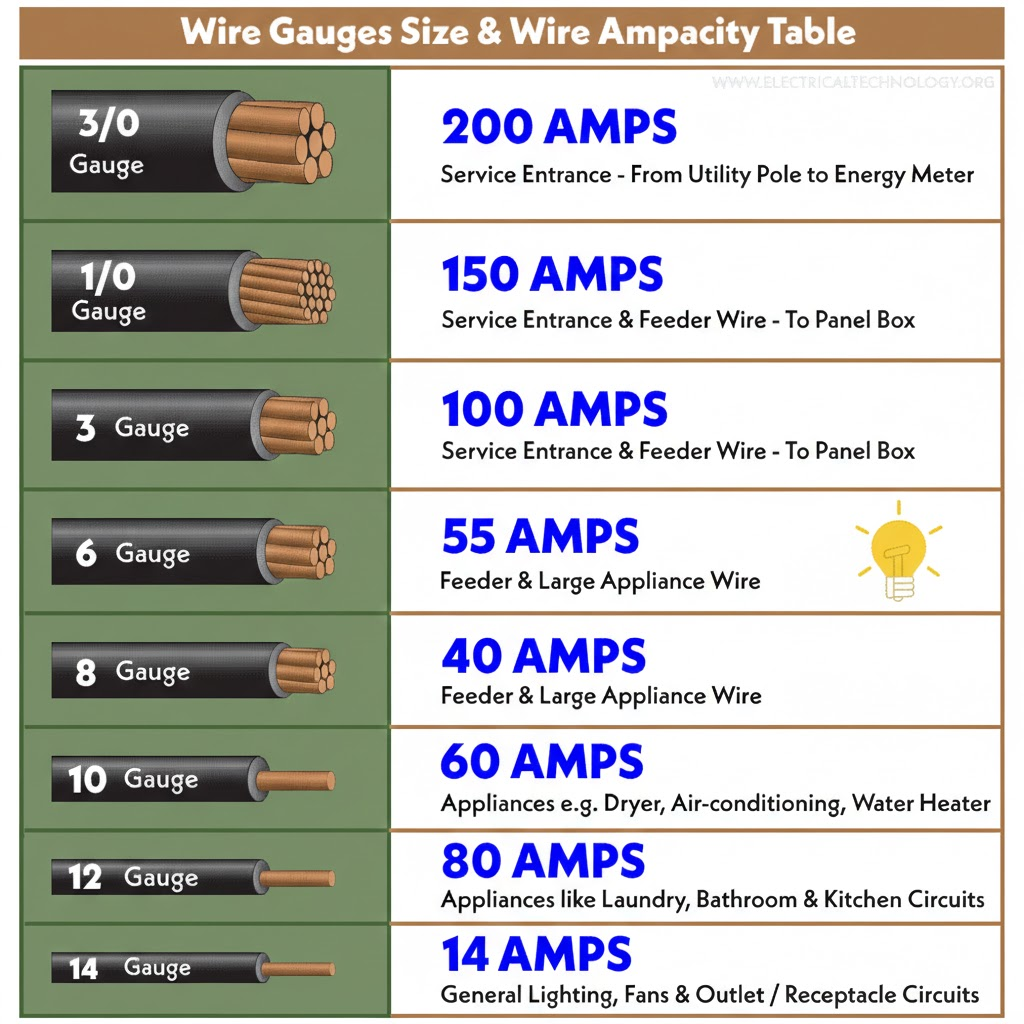
Wire must handle continuous current without excessive voltage drop. At 48V, a 50A continuous load requires 6 AWG copper for runs under 10 feet. At 12V, that same 50A needs 2 AWG for identical voltage drop. This is why high voltage systems save significantly on copper cost. Voltage drops above 2% wastes power and reduces inverter input voltage which triggers low-voltage cutoffs under load. I size wire for 1% to 1.5% drop maximum on battery to inverter runs.
Fusing and Overcurrent Protection:
Install fuses at every point where current can split or where cable connects to battery terminals. Size fuses at 125% of maximum expected continuous current. Between 48V battery and 5kW inverter: 5,000W ÷ 48V = 104A continuous, fuse at 130A minimum. Use Class-T fuses for fast fault clearing or ANL fuses for cost-effective protection. Fuse placement protects cable, not components. One unfused cable is one potential fire.
Proper wiring is invisible when done correctly. You only notice it when voltage sag kills inverter performance or a thermal failure destroys the installation.
Step 9: Temperature Management
Temperature determines whether your lithium battery delivers rated cycle life or fails years early. LiFePO4 tolerates heat better than other lithium chemistries, but cold weather creates immediate damage risk that most installers ignore until after the first winter failure.
I design thermal management around one absolute rule: never charge lithium batteries below 0°C. Everything else is optimization. Violate this and you cause permanent capacity loss through lithium plating.
Cold Weather Charging Prohibition:
Charging LiFePO4 below freezing causes lithium metal to plate onto the anode surface instead of intercalating properly into the graphite structure. This plating is irreversible. Each cold charge event removes usable capacity permanently and creates internal short-circuit risk. Your BMS must enforce charge temperature cutoffs. Quality BMS units disable charging below 0°C and some implement heating cycles before allowing charge current. Capacity also drops 20% to 40% in freezing conditions even without charging. A 10kWh bank delivers 6kWh to 8kWh at minus 10°C.
Cold Weather Solutions:
Self-heating batteries include internal heating elements powered by the battery itself. These maintain minimum charge temperature automatically. Insulated battery enclosures with thermostatically controlled heaters work for stationary installations. Proper enclosure design balances thermal mass, insulation, and controlled heating. In extreme climates, installing batteries in conditioned spaces eliminates the problem entirely. The cost of heating is less than replacing degraded cells.
Hot Weather Considerations:
LiFePO4 handles heat better than NMC or NCA chemistries but still requires ventilation above 45°C ambient. High temperatures accelerate calendar aging and increase self-discharge rates. Internal resistance rises with temperature causing voltage sag under load. Proper ventilation, avoiding direct sun exposure, and allowing convection airflow maintain acceptable operating temperature. In enclosed installations, forced air circulation or air conditioning may be necessary.
Temperature management is not optional. Cold charging causes immediate damage. Heat accelerates aging. Understanding how temperature affects battery behavior and building appropriate thermal controls determines whether your battery lasts three years or ten.
Step 10: Code Compliance
Code compliance determines whether your installation is insurable, legally defensible, and safe for long-term operation. Skipping permits and inspections creates liability that follows the system for its entire life. Insurance companies deny claims on unpermitted electrical work regardless of fault.
I design every system to meet National Electrical Code requirements because code compliance is the minimum standard for professional work, not an optional upgrade.
Why Compliance is Non-Negotiable:
Unpermitted systems cannot be insured as electrical installations. Home sales require disclosure of unpermitted work which reduces property value or kills transactions entirely. If a system causes fire or injury, lack of permits exposes the installer and owner to legal liability that insurance will not cover. Code compliance is risk management, not bureaucracy.
Key NEC Requirements:
Article 690 governs photovoltaic systems and covers conductor sizing, overcurrent protection, grounding, and system labeling. Article 706 covers energy storage systems including battery clearances, disconnecting means, and ventilation requirements. Systems must use UL-listed components: UL 9540 for energy storage systems, UL 1973 for batteries, UL 1741 for inverters. These certifications verify the components meet safety testing standards.
Working with Your Authority Having Jurisdiction:
Contact your local building department before starting installation. Requirements vary significantly between jurisdictions even within the same state. Submit complete system diagrams, component specifications, and calculations for review. Schedule inspections at rough-in and final stages. Common rejection issues include missing disconnects, inadequate labeling, wrong wire types, and insufficient working clearances around equipment. Address these during design, not after installation.
Most jurisdictions now have streamlined solar permitting processes. The paperwork takes hours. Fixing an unpermitted system later takes weeks and costs thousands in retrofit work.
Code compliance protects everyone. It ensures qualified inspectors verify safety before energizing high-voltage DC systems. It documents the installation for future owners. It satisfies insurance underwriting requirements. Skip it and you have built technical debt that eventually comes due.
Complete System Design Example
A worked example demonstrates how all design decisions integrate into a functional system. This 8 kWh per day cabin system in Colorado illustrates the complete engineering process from load calculation through component specification.
System Requirements:
The cabin consumes 8 kWh daily from LED lighting, refrigeration, water pumping, and electronics. Colorado climate requires 3 days autonomy for winter storm coverage. Ambient temperatures range from minus 15°C to 35°C. Site receives good solar exposure year-round.
System Voltage Selection:
48V nominal selected because daily consumption exceeds 5 kWh and allows efficient wire sizing. Load analysis shows 2kW peak simultaneous demand which at 12V would require 167A continuous current and 0 AWG cable. At 48V, current drops to 42A and 8 AWG cable suffices.
Battery Sizing Calculation:
Daily consumption 8 kWh, 3 days autonomy, 80% DoD target, 85% system efficiency. (8 kWh × 3 days) ÷ 0.80 = 30 kWh ÷ 0.85 = 35.3 kWh total capacity needed. At 48V nominal (51.2V): 35,300 Wh ÷ 51.2V = 689 Ah. Specified: 16S3P configuration using 280Ah LiFePO4 cells = 51.2V, 840Ah, 43 kWh total capacity, 34.4 kWh usable at 80% DoD. This provides 22% margin above the calculated requirement.
Component Specifications:
BMS rated 48V, 100A continuous, 200A peak, with temperature-controlled charge cutoff below 0°C and CAN communication. MPPT charge controller: 3kW solar array (3,000W ÷ 48V) × 1.25 = 78A, specified 80A MPPT with lithium profile. Inverter: 2kW continuous loads plus 1kW well pump with 3× surge = 5kW surge requirement, specified 3kW continuous, 6kW surge pure sine inverter with 48V input and CAN battery communication. Wire sizing: 8 AWG copper, battery to inverter 6-foot run, 1.2% voltage drop at 65A.
System Cost:
Components total $8,200, installation $2,400, permits $400. Total $11,000 before 30% federal tax credit, net cost $7,700.
This example demonstrates how proper engineering produces reliable, code-compliant systems that deliver rated performance for their design life.
System Monitoring & Optimization
System monitoring transforms a battery installation from a black box into a managed asset. Without data, you operate blind until failure occurs. With proper monitoring, degradation becomes visible months before it affects performance, allowing intervention instead of emergency replacement.
I configure monitoring to track five critical metrics that predict system health and identify problems early.
Critical Metrics to Track:
State of charge tells you usable energy remaining and prevents unexpected shutdowns. Voltage at both pack and cell level reveals imbalance, charging issues, and load-induced sag. Current monitoring shows charge and discharge rates which indicate whether your solar harvest matches consumption patterns. Temperature tracking identifies thermal stress from poor ventilation, high ambient conditions, or internal resistance issues. Daily energy production versus consumption reveals seasonal patterns and helps optimize load scheduling.
Smart Monitoring Solutions:
Modern BMS units include Bluetooth connectivity for phone-based monitoring. WiFi-enabled systems upload data to cloud dashboards accessible from anywhere. Quality monitoring tracks voltage drift between cells which predicts balancing failures before they limit capacity. Historical data logging identifies trends invisible in real-time observation. I specify monitoring systems that log at minimum hourly intervals with cell-level resolution.
Energy Management Strategies:
Load shifting moves high-consumption activities to peak solar hours. Running washing machines, water heating, and power tools during midday maximizes direct solar use and minimizes battery cycling. Peak shaving limits simultaneous high loads to prevent inverter overload and excessive discharge currents. Scheduled activities based on state of charge prevent deep discharge events. A system showing 30% SOC at sunset indicates either undersized battery bank or excessive daytime consumption that needs load adjustment.
Performance Benchmarking:
Track cycle counts, depth of discharge distribution, and charge acceptance over time. Declining charge acceptance indicates cell degradation or communication issues between BMS and inverter. Increased voltage spread between cells shows balancing problems. Rising operating temperature suggests ventilation inadequacy or internal resistance growth.
Monitoring converts invisible degradation into actionable data. Without it, you discover problems only after they cause system failure.
Common Mistakes to Avoid
Lithium battery system failures follow predictable patterns. I troubleshoot the same design and installation errors repeatedly across different installations, climates, and component brands. These mistakes are preventable through proper engineering discipline.
Design Phase Errors:
Undersizing battery banks is the most common failure. Users calculate nameplate capacity without accounting for depth of discharge limits, system efficiency losses, or future expansion. A 10 kWh bank operated at 100% DoD daily fails in 1,000 to 1,500 cycles. The same bank sized to 15 kWh and operated at 67% DoD delivers 5,000+ cycles. Mismatched component voltages create efficiency losses or require conversion equipment. Ignoring temperature effects on capacity causes winter performance complaints when the same system worked fine in summer. Not planning for surge loads results in inverter shutdowns during motor starts despite adequate average capacity.
Installation Errors:
Charging lithium batteries below freezing causes immediate permanent damage through lithium plating. This is the fastest way to destroy capacity. Bypassing BMS protections to extract more capacity eliminates your primary safety system. Mixing old and new batteries in parallel creates uneven current sharing and accelerated aging of the weaker cells. Improper wire sizing causes voltage drop that triggers low-voltage cutoffs under load even with adequate battery capacity. Inadequate fusing creates fire risk by allowing fault currents to flow through undersized conductors. Poor crimping and loose connections increase resistance, generate heat, and create intermittent failures.
Operational Mistakes:
Not monitoring system health allows degradation to progress undetected. Ignoring BMS warnings about temperature, voltage, or imbalance leads to premature failure. Repeatedly overloading the inverter stresses components and shortens lifespan. Neglecting maintenance like terminal inspection and firmware updates allows small problems to become major failures. Expanding systems without proper planning by adding mismatched batteries or exceeding component ratings.
Every mistake listed here is preventable through proper design, careful installation, and disciplined operation. Most lithium battery failures are engineering failures, not component failures.
Cost Breakdown & ROI
System cost determines feasibility but total cost of ownership determines value. Upfront pricing varies significantly based on component quality, installation complexity, and whether you hire professionals or install yourself. Understanding real costs prevents budget surprises and enables informed decisions.
I price systems based on 2025 market rates including federal tax credits and realistic installation requirements.
2025 System Pricing by Scale:
Small cabin systems delivering 2 to 5 kW cost $5,600 to $14,300 installed. This includes 5 to 10 kWh battery capacity, 1 to 2 kW solar array, MPPT controller, and inverter. Medium home systems providing 8 to 12 kW run $21,800 to $34,500 with 15 to 25 kWh storage and 4 to 6 kW solar capacity. Large homestead installations rated 15 to 25 kW range from $43,000 to $73,500 with 30 to 50 kWh battery banks and 8 to 12 kW arrays. All prices include the 30% federal investment tax credit available through 2032.
DIY vs Professional Installation:
DIY installation saves 40% to 60% on labor costs but requires electrical expertise, proper tools, and code knowledge. You still need permits and inspections which cost $300 to $800 depending on jurisdiction. Professional installation includes design, permitting, installation, and warranty but adds $3,000 to $15,000 depending on system complexity. I recommend professional installation for systems above 5 kW unless you hold electrical licensing and have verifiable experience with DC systems and battery integration.
Lifetime Cost Analysis:
LiFePO4 batteries last 10 to 15 years with proper management. Inverters typically need replacement at 10 to 12 years. Solar panels degrade 0.5% annually but function for 25+ years. MPPT controllers last 8 to 12 years. Total system lifespan is 20 to 25 years with one battery replacement and one inverter replacement. Maintenance costs are minimal, mostly terminal inspection and firmware updates. Grid power at $0.15 per kWh costs $4,380 annually for 8 kWh daily consumption. A properly sized off-grid system paying for itself in 5 to 8 years depending on local electricity rates and system size.
Conclusion
Designing an off-grid lithium battery power system is systematic engineering, not product selection. Every decision from system voltage through wire gauge affects performance, safety, and lifespan. The difference between a system that delivers rated capacity for ten years and one that fails in three comes down to disciplined application of these principles.
Proper sizing accounts for depth of discharge limits, system efficiency losses, and realistic autonomy requirements, not just nameplate capacity. Component matching ensures voltage compatibility, communication integration, and coordinated protection across battery, charge controller, and inverter. Safety implementation through BMS protection, proper fusing, and code-compliant installation is non-negotiable because lithium chemistry has no tolerance for operating outside its electrochemical boundaries. Temperature management prevents cold-weather charging damage and heat-accelerated aging that silently reduces cycle life.
The systems that fail do so predictably through undersized batteries cycled too deeply, mismatched components operating with poor efficiency, inadequate BMS protection allowing damaging operating conditions, and temperature extremes ignored during design. These are engineering failures, not component defects.
Your Action Plan:
Complete an honest energy audit measuring actual consumption, not estimates. Calculate battery requirements using the four-step formula accounting for autonomy, depth of discharge, and system losses. Select system voltage based on power levels and wire run economics. Create a detailed parts list verifying voltage compatibility and communication capability across all components. Review NEC Article 690 and 706 requirements and contact your local building department for jurisdiction-specific rules. Decide whether your electrical expertise justifies DIY installation or whether professional help reduces risk and ensures code compliance.
Quick Reference Formulas:
Battery sizing: (Daily kWh × Days Autonomy) ÷ 0.80 DoD ÷ 0.85 Efficiency = Total kWh needed. MPPT sizing: (Solar Array Watts ÷ System Voltage) × 1.25 = Minimum Controller Amps. Wire gauge: Calculate for maximum 1.5% voltage drop at continuous current. For deeper understanding of battery internal architecture and cycle life optimization, these resources provide essential foundation knowledge.
Start with conservative sizing. Expand as you learn. Your energy independence begins with one properly engineered system.

I am Engr. Ubokobong Ekpenyong, a solar specialist and lithium battery systems engineer with over five years of hands-on experience designing, assembling, and commissioning off-grid solar and energy storage systems. My work focuses on lithium battery pack architecture, BMS configuration, and system reliability in off-grid and high-demand environments.
Thanks for walking through the detailed process of sizing a lithium battery system—especially the voltage comparison analysis was really helpful in understanding how higher voltages can reduce losses and improve efficiency. I’m curious about your take on managing temperature in off-grid systems, particularly in hot climates, since that seems like a critical factor in long-term BMS performance. The real-world example at the end made it easy to visualize how these calculations translate into practical design decisions.
Thank you, Seedream — I’m glad the voltage comparison section helped clarify why higher system voltages can significantly reduce current, cable losses, and overall system stress.
You’re absolutely right about temperature. In hot climates, thermal management becomes one of the most important design considerations for lithium systems. Elevated temperatures accelerate cell degradation, increase internal resistance over time, and can affect BMS measurement accuracy. In practice, good system design usually includes adequate ventilation, shaded equipment placement, and temperature monitoring at the cell or pack level so the BMS can adjust charging or trigger protection if limits are exceeded.
In larger off-grid installations, passive cooling strategies (airflow, spacing, thermal isolation from inverters and charge controllers) often make a big difference in long-term battery health.
I appreciate the thoughtful question, thermal management is definitely a topic worth exploring in more depth in future posts.
Great breakdown on the move toward 800V systems; I’ve often found that the significant efficiency gains from lower power losses are overlooked in smaller DIY builds. Do you find that the increased complexity in code compliance for these higher voltages typically discourages hobbyists, or is it becoming more manageable with contemporary hardware?
That’s a genuinely insightful observation, and one I think deserves a direct answer rather than a diplomatic dodge.
The honest truth is that 800V architecture does create a steeper compliance curve, NEC Article 706 combined with the high-voltage DC disconnect requirements and the need for UL 9540A-rated components means the paperwork alone can feel overwhelming to someone coming from the hobbyist 48V world. Arc flash considerations, insulation ratings, and the requirement for properly rated PPE during commissioning are not things most DIYers have had to think about before.
That said, I’d argue the barrier is becoming more accessible, not less, for a few reasons. Modular high-voltage battery systems from manufacturers like PYLONTECH and DYNESS ship pre-certified with integrated BMS and communication stacks, so the builder doesn’t have to engineer the dangerous parts from scratch. SMA, Victron, and Deye now offer inverters designed explicitly for high-voltage DC input with pre-built compliance documentation that simplifies the AHJ submission process considerably.
Where I still see hobbyists struggle is the cultural gap rather than the technical one, the DIY community built its knowledge base around 12V and 48V, so the forums, YouTube walkthroughs, and peer support networks haven’t fully caught up to 800V design patterns yet. That’s changing, but slowly.
My practical recommendation for serious DIYers eyeing higher voltage builds: start by getting comfortable with Article 706 compliance at 48V first. The discipline transfers directly; only the component ratings and arc-flash awareness change when you step up. The efficiency gains you correctly identified are real and worth pursuing, just with eyes open to the fact that higher voltage demands higher rigor, not just higher component specs.