Introduction
Three weeks after handover, a correctly specified and installed system developed a fault that the installing technician could not clear. The Cerbo GX was showing a BMS communication alarm. The MPPT controller had reverted to its locally programmed charge profile and was pushing the battery bank to an absorption voltage 0.4V above the Pylontech BMS’s CVL. The BMS was responding by throttling the charge current through its CCL output, which the MPPT was ignoring because the communication link it needed to receive that instruction was the same link that was faulted. The battery was being overcharged in slow motion.
The technician replaced the MPPT controller. The fault persisted. He replaced the Cerbo GX. The fault persisted. On the third visit, a different technician found the root cause in four minutes: the VE.Can connector on the back of the Cerbo GX had not been fully seated at installation and had worked loose over three weeks of thermal cycling. Reseating the connector cleared every alarm. The replaced components were unnecessary. The two return visits were unnecessary. The overcharge events that had occurred during the three weeks of faulted communication had measurably stressed the battery bank. All of it was traceable to the absence of a structured diagnostic approach at the first visit.
Commissioning and fault diagnosis are engineering disciplines with the same rigour as component selection and cable sizing. The technician who can read a Cerbo GX alarm, identify which subsystem it implicates, take one measurement that confirms or eliminates the most likely root cause, and work through the fault tree systematically is more valuable to a client than one who can select the correct MPPT controller but has no framework for what to do when it stops working. This post builds that framework for the cluster system.
The Cerbo GX as the System Monitoring Hub

The Cerbo GX occupies a unique position in the cluster system architecture. It is simultaneously a communication device, a monitoring platform, a data logger, and an alarm management system. Every component in the system that generates a measurable parameter connects to the Cerbo GX, and every parameter the system generates is logged, displayed, and made available for remote access through the VRM portal. Understanding what the Cerbo GX aggregates, how it presents that data, and what its normal operating display looks like is the prerequisite for using it as a diagnostic tool rather than simply as a display screen.
The three communication interfaces that feed the Cerbo GX in the cluster system are VE.Can from the Victron SmartSolar MPPT 150/60, VE.Bus from the Victron Multiplus-II 48/3000, and the Pylontech CAN bus via the VE.Can-to-CAN adapter. From the MPPT controller the Cerbo GX receives solar array voltage, array current, charge current to battery, controller operating state, and daily and cumulative solar yield.
From the Multiplus-II it receives AC input voltage and frequency, AC output voltage and frequency, AC load current, battery charge and discharge current, inverter operating state, and all active alarms. From the Pylontech BMS it receives individual cell voltages, bank state of charge, battery temperature, and the CVL, CCL, and DCL values the BMS is currently transmitting to the charge sources.
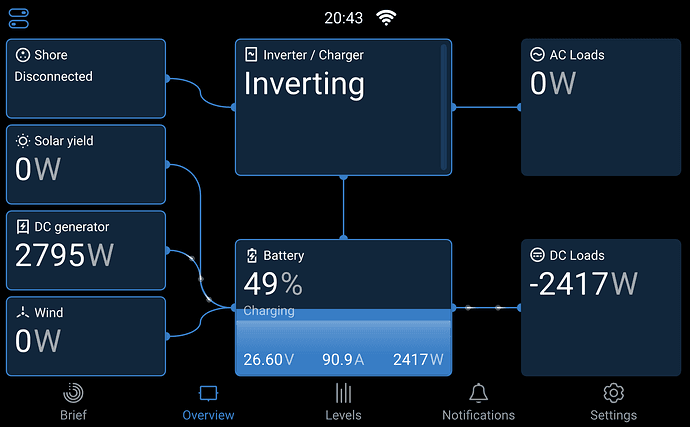
The GX Touch display presents this aggregated data as a real-time system overview showing the power flows between the array, the battery, the inverter, and the AC loads simultaneously. The display updates every two seconds and provides an immediate visual indication of whether the system is in normal operation, in an alarm state, or in a degraded operating mode where one or more communication links are faulted.
The VRM portal extends this monitoring capability to remote access. A VRM account linked to the Cerbo GX’s system ID provides access to real-time system data from any internet-connected device, 90-day historical logs at 15-minute resolution, and configurable alerts that send an email or SMS when a monitored parameter crosses a configured threshold. The alerts that must be configured at commissioning for the cluster system are battery low voltage below 46V, battery high temperature above 40°C, inverter overload, BMS communication loss, and solar yield below 20 percent of the daily average for three consecutive days.
Cerbo GX Monitoring Parameters by Source:
MPPT 150/60 via VE.Can -> array voltage, array current, charge current, daily yield, state

Multiplus-II via VE.Bus -> AC input/output voltage and frequency, load current, alarms

Pylontech BMS via CAN -> cell voltages, bank SoC, battery temperature, CVL, CCL, DCL

Cerbo GX internal -> system time, internet connection status, VRM connection status

VRM portal -> 90-day historical logs, configurable alerts, remote parameter access
For the communication architecture between the Cerbo GX and the MPPT controller, inverter-charger, and BMS that this monitoring section builds on, refer to our engineering guides on how to size and select an MPPT controller for a specific system, how to size and select an off-grid inverter — complete worked example, and battery bank sizing, configuration, and BMS selection.
The Commissioning Sequence
The commissioning sequence in Off-Grid Solar Systems is the ordered procedure by which a fully wired but unenergised system is brought into operation one stage at a time, with each stage verified against a defined pass criterion before the next stage is activated. Its purpose is not bureaucratic. It is to ensure that a fault condition introduced during installation is detected at the earliest possible stage, when the number of energised components is small and the fault is easiest to isolate, rather than at the final stage when the full system is live and the fault could be anywhere.
Stage 1: Pre-Energisation Checks

With all components installed but no battery connected and no circuit breakers closed, verify the following before any source of energy is introduced to the system. Confirm all DC cable terminations are correctly torqued at battery busbars, MPPT controller terminals, and inverter DC input terminals. Confirm all fuse ratings against the cable sizing specification from Post #10. Confirm earth continuity from the earth bar to the earth electrode with a low-resistance ohmmeter. Confirm AC cable terminations at the distribution board, including RCBO ratings against the circuit specification from Post #11: AC Wiring for Off-Grid Systems.
Confirm the VE.Can connector is fully seated on the Cerbo GX rear panel. Confirm the VE.Bus cable is connected between the Multiplus-II and the Cerbo GX. Confirm the VE.Can-to-CAN adapter is connected between the Pylontech BMS CAN port and the Cerbo GX VE.Can port.
Stage 2: Battery Connection and BMS Communication Verification
Connect the battery bank positive and negative cables to the busbar. Power the Cerbo GX from the battery bank. Navigate to the Cerbo GX device list and confirm the Pylontech BMS appears as a connected device. Confirm the CVL, CCL, and DCL values are visible on the Cerbo GX display and match the expected values: CVL 57.6V, CCL 100A, DCL 148A. If any of these values are absent or incorrect, the BMS communication link is not established and the fault must be resolved before proceeding. Activating the MPPT controller without confirmed BMS communication means the controller will operate on its locally programmed charge profile without CVL or CCL constraints.
Stage 3: MPPT Controller Activation
Close the DC isolator between the combiner box and the MPPT controller input. Confirm the MPPT controller appears on the Cerbo GX device list. Confirm the string voltage at the MPPT controller input is within the expected range for the time of day and solar conditions. Confirm the charge current is positive and below the CCL value transmitted by the BMS. Confirm the controller’s operating state shows bulk, absorption, or float as appropriate for the battery’s current state of charge. Allow the MPPT controller to operate for a minimum of 30 minutes and confirm no high voltage alarms are generated.
Stage 4: Inverter Activation
Switch the Multiplus-II to inverter mode with no AC input connected. Confirm the AC output voltage at the distribution board incomer terminals is 230V ±2 percent. Confirm the AC output frequency is 50Hz ±0.5Hz. Confirm the waveform is pure sine wave using a clamp meter with waveform display or a power quality analyser if available. Confirm the Multiplus-II appears on the Cerbo GX device list with inverter mode active and no alarm conditions.
Stage 5: AC Load Connection

Connect the AC loads circuit by circuit, starting with the lowest current circuit. After each circuit is connected, confirm the Cerbo GX AC load reading increases by the expected amount for the connected load. Confirm no RCBO trips occur on connection. After all circuits are connected, confirm the total AC load reading on the Cerbo GX is consistent with the expected simultaneous load from the Post #1 load audit.
Stage 6: Generator Integration Test

Connect the generator to the Multiplus-II AC input terminal. Start the generator and allow it to stabilise. Confirm the Multiplus-II detects the generator source and transfers the AC output from inverter to passthrough mode. Confirm the battery begins charging at the configured AC input current limit. Measure the transfer time from generator start to stable AC output on the distribution board and confirm below 20 milliseconds. Stop the generator and confirm the Multiplus-II transfers back to inverter mode without a load interruption.
Stage 7: VRM Configuration and Documentation
Register the Cerbo GX system on the VRM portal. Configure the five alert thresholds established in Section 1. Export the Cerbo GX system configuration to a file and include it in the commissioning documentation package. Confirm the VRM portal shows live data from all three communication interfaces.
Commissioning Sequence Checklist:
Stage 1: Pre-energisation -> cable torque, fuse ratings, earth continuity, connector seating

Stage 2: BMS communication  -> CVL 57.6V, CCL 100A, DCL 148A confirmed on Cerbo GX

Stage 3: MPPT activation -> string voltage in range, charge current below CCL, no HV alarm

Stage 4: Inverter activation -> 230V ±2%, 50Hz ±0.5Hz, pure sine wave, no alarms

Stage 5: AC load connection -> load current matches expected, no RCBO trips

Stage 6: Generator test -> transfer confirmed, charge confirmed, transfer time < 20ms

Stage 7: VRM configuration -> portal registered, alerts configured, configuration exported
Reading the Cerbo GX and VRM Data
A system that has been commissioned correctly and is operating normally produces a recognisable pattern of data on the Cerbo GX display and in the VRM historical logs. Knowing what normal looks like is the prerequisite for identifying what abnormal looks like, and recognising an anomaly in the VRM data before it produces a visible fault condition is the difference between proactive maintenance and reactive fault diagnosis.
The solar yield curve for a coastal West Africa installation at approximately 6 degrees north latitude follows a predictable daily profile. The MPPT controller begins delivering charge current within 30 to 45 minutes of sunrise, typically between 06:30 and 07:00.
The array output ramps steeply through the morning, reaches a midday plateau between approximately 10:00 and 14:00 where the output is close to the array’s derated capacity of 1,724W, and then declines through the afternoon as solar elevation decreases and cell temperature rises above its peak.
On clear days the plateau is broad and flat. On days with intermittent cloud cover the plateau shows characteristic dips and recoveries. On overcast days the curve is suppressed uniformly, typically delivering 20 to 40 percent of clear-sky yield.
The battery state of charge follows a complementary daily cycle. At sunrise the SoC is at its daily minimum, reflecting the overnight discharge from the previous evening’s loads. Through the morning the SoC rises as the solar yield exceeds the running load. In a correctly sized system the SoC reaches 100 percent during the midday plateau and the MPPT controller transitions from absorption to float mode. The float condition persists through the early afternoon. As solar yield declines in the late afternoon and the evening load begins, the SoC starts falling again and continues falling through the night.
Deviations from this pattern are the primary diagnostic signal in the VRM data. A battery that does not reach 100 percent SoC during the midday plateau on a clear day indicates either that the daily demand has increased above the Post #1 estimate, that the array is underperforming relative to its derated output, or that the BMS is limiting the charge current below what the array can deliver. Each of these has a different root cause and a different corrective action, and the VRM data provides the measurements needed to distinguish between them.
Normal Operating Parameter Reference:
Array output at midday plateau -> 1,500 to 1,724W on clear days (derated array capacity)

Battery SoC at sunrise -> 60 to 75% after overnight discharge at rated daily demand

Battery SoC at midday -> 95 to 100% on clear days, 70 to 85% on overcast days

MPPT operating state at midday -> absorption or float on clear days, bulk on overcast days

AC load reading -> consistent with Post #1 simultaneous load estimate

Cell voltage spread at full charge -> below 20mV between highest and lowest cell

Overnight discharge rate -> consistent with Post #1 load profile, no unexpected spikes
Phantom load detection is one of the most practically useful applications of the VRM overnight data. The AC load reading on the Cerbo GX at 02:00 reflects the sum of all standby and phantom loads in the installation. A non-zero reading at this hour that exceeds the estimate from the phantom load audit indicates an unaccounted load drawing power overnight. For the methodology behind phantom load identification and quantification, refer to our engineering guide on understanding phantom loads and standby power in off-grid systems.
The Four Most Common Fault Conditions
The four fault conditions that account for the majority of post-commissioning service calls on correctly specified Victron and Pylontech systems each have a characteristic symptom, a specific subsystem they implicate, a single measurement that confirms or eliminates the most likely root cause, and a corrective action that does not require component replacement in the majority of cases.
Fault 1: BMS Communication Loss
Symptom: Cerbo GX displays a BMS communication alarm. The Pylontech battery disappears from the Cerbo GX device list or appears with no CVL, CCL, or DCL values. The MPPT controller transitions to its locally programmed charge profile. If the locally programmed absorption voltage exceeds the Pylontech CVL of 57.6V, the battery voltage rises above the BMS’s expected maximum and a high voltage alarm may follow.
Implicated subsystem: the CAN communication path between the Pylontech BMS and the Cerbo GX, comprising the BMS CAN port, the CAN cable, the VE.Can-to-CAN adapter, and the VE.Can port on the Cerbo GX.
First measurement: inspect the VE.Can connector on the Cerbo GX rear panel for full seating. Inspect the CAN cable between the BMS and the adapter for continuity. Navigate to the Cerbo GX device list and confirm whether the Pylontech appears as a connected device with valid parameters.
Root cause in the majority of field cases: unseated VE.Can connector, failed CAN cable, or incorrect CAN termination resistor configuration. Component failure of the adapter or Cerbo GX VE.Can port is uncommon.
Corrective action: reseat all connectors, replace the CAN cable if continuity fails, verify the CAN termination resistor is installed at one end of the bus and absent at the other. Confirm CVL, CCL, and DCL return to expected values before closing the fault.
Fault 2: MPPT High Voltage Alarm
Symptom: Cerbo GX displays an MPPT high voltage alarm. The MPPT controller has detected an input voltage above its rated maximum and has disconnected the array to protect its input stage. The battery is not being charged and the system is running from battery only.
Implicated subsystem: the DC input circuit from the array strings to the MPPT controller, specifically the open-circuit voltage of the array under the current ambient temperature conditions.
First measurement: measure the open-circuit voltage at the MPPT controller input terminals with the MPPT disconnected from the array. Compare against the cold Voc calculation:
Voc_cold = N_series x Voc_STC x (1 + (coeff_Voc x (T_min – 25)))
Voc_cold = 3 x 41V x (1 + (-0.0029 x (18 – 25))) = 125.5V
If measured voltage > 135V (90% of 150V controller rating) -> string incompatible
If measured voltage < 135V -> transient condition, monitor for recurrence
Root cause in the majority of field cases: incorrect string configuration specified at design stage, subsequent addition of panels to an existing string without recalculating Voc, or a transient load dump condition.
Corrective action: if the cold Voc calculation confirms the string is within the controller’s 90 percent voltage limit, reset the alarm and monitor for recurrence. If the string voltage exceeds the limit, reduce the series string count or replace the controller with a higher voltage model.
Fault 3: Inverter Overload Shutdown
Symptom: Cerbo GX displays an inverter overload alarm. The Multiplus-II has shut down its AC output after detecting a load current that exceeded its surge rating. All AC loads have lost power.
Implicated subsystem: the AC output circuit, specifically the connected load that triggered the overload, which is most commonly a motor or compressor starting without a soft starter.
First measurement: identify which load was starting at the moment of shutdown by reviewing the Cerbo GX AC load log in the seconds before the alarm. The load reading will show a spike to the overload level immediately before the shutdown event.
Root cause in the majority of field cases: air conditioner compressor starting without a soft starter producing an inrush current that exceeds the Multiplus-II 48/3000’s 5,500VA surge rating, or multiple high-inrush loads starting simultaneously.
Corrective action: install a soft starter on the air conditioner compressor as specified in Post #9. If multiple loads are implicated, implement load scheduling to prevent simultaneous starting. Confirm the soft starter reduces inrush to below the inverter’s surge rating before returning the system to normal operation.
Fault 4: Battery High Temperature Warning
Symptom: Cerbo GX displays a battery high temperature warning. The Pylontech BMS has detected a cell temperature at or above 45°C and has transmitted a CCL of zero to the charge sources, preventing any further charging. The battery continues to discharge through the inverter but the array cannot recharge it. The system will deplete the battery and shut down if the temperature condition is not cleared.
Implicated subsystem: the battery enclosure thermal environment, specifically the equipment room ambient temperature and the enclosure ventilation.
First measurement: measure the equipment room ambient temperature with a calibrated thermometer at the height of the battery enclosure. Compare against the 37°C maximum equipment room ambient established in Post #12. If the equipment room ambient is above 37°C, the cell temperature will be above 45°C given the 8°C self-heating margin from the discharge current.
Root cause in the majority of field cases: equipment room ventilation failure, ventilation not installed during original commissioning, or dry season ambient temperatures exceeding the design assumption.
Corrective action: restore or install forced ventilation to reduce equipment room ambient below 37°C. While the temperature condition persists, the battery cannot be charged and the load must be shed to slow the discharge. Do not attempt to override the Pylontech BMS temperature cutoff through configuration changes. It is a protection function, not a nuisance alarm.
| Fault | First Symptom | First Measurement | Likely Root Cause |
| BMS communication loss | BMS off device list | VE.Can connector seating | Unseated connector or failed CAN cable |
| MPPT high voltage alarm | Array disconnected | Voc at MPPT input terminals | String Voc exceeds 90% of controller rating |
| Inverter overload shutdown | AC loads dead | AC load log at shutdown moment | Compressor inrush without soft starter |
| Battery high temperature | Charging stopped | Equipment room ambient temp | Ventilation failure or absent |
DC Ground Fault Detection and Diagnosis
A DC ground fault is an unintended electrical connection between a DC conductor and the system protective earth. It is the fault condition that most consistently evades detection on off-grid systems because its symptoms, taken individually, are indistinguishable from several other common fault conditions, and because the DC side of the system has no equivalent of the AC residual current device that would trip immediately on detecting earth leakage current.
A DC ground fault can persist for weeks or months before it produces a symptom severe enough to prompt investigation, and during that period it is slowly discharging the battery bank through the fault resistance, stressing the BMS protection circuits, and in the worst case creating a shock hazard at any earthed metal surface in the installation.
The symptoms that should prompt a DC ground fault investigation are: unexplained battery discharge overnight that exceeds the phantom load estimate by a consistent margin, intermittent BMS low voltage alarms that do not correspond to the battery SoC shown on the Cerbo GX, erratic MPPT controller behaviour during periods when the array is operating normally, and any measurement of a voltage between a DC conductor and the system earth that is not close to zero.
The measurement procedure for confirming a DC ground fault uses a calibrated multimeter set to DC voltage. With the system operating normally, measure the voltage between the DC positive busbar and the system earth bar. On a correctly wired system with a single DC negative-to-earth bond at the inverter and no ground faults, this measurement will show a voltage close to the full battery voltage.
The measurement that confirms a ground fault is the voltage between the DC negative busbar and earth. On a correctly wired system this should be zero or within a few millivolts. A measurable voltage on the DC negative bus relative to earth indicates either a second earth bond point creating a voltage differential, or a ground fault on the DC negative conductor.
DC Ground Fault Measurement Procedure:
Step 1 -> measure DC positive bus to earth: expect ~51V on a healthy system at nominal SoC

Step 2 -> measure DC negative bus to earth: expect 0V ±50mV on a healthy system

Step 3 -> if DC negative to earth is non-zero: suspect second earth bond or negative fault

Step 4 -> isolate array strings one by one, measure after each isolation

Step 5 -> when measurement returns to zero, the isolated string contains the fault

Step 6 -> inspect that string's cable run for insulation damage

Step 7 -> check roof penetrations, junction box seals, and conduit entries for water ingress
The most common physical locations for DC ground faults on tropical off-grid installations are the roof penetration points where array cables pass through the roof surface, the junction boxes on the rear of the panels where water ingress through a failed gasket can create a conductive path between the cable insulation and the panel frame, and the conduit entry points at the combiner box where chafing from vibration or thermal expansion has abraded the cable insulation against a metal edge.
A DC ground fault on the positive bus is more hazardous than one on the negative bus because the positive bus fault produces a shock hazard at the earthed metal surface through which the fault current is flowing, whereas a negative bus fault produces a shock hazard only if a person simultaneously contacts the positive bus and the faulted earth point.
Battery State of Health Monitoring
State of health is the metric that answers the question the nameplate capacity cannot: how much usable energy does this battery bank actually deliver today, expressed as a percentage of what it delivered when new. The Cerbo GX does not calculate or display SoH directly. It logs the data from which SoH can be calculated manually, and doing this calculation annually is the maintenance discipline that provides advance warning of capacity loss before it produces an operational problem.
The manual SoH calculation uses two figures from the VRM historical data. The first is the energy delivered by the battery bank from a confirmed full charge to the next BMS low voltage protection event or the next morning’s solar recharge. The second is the nameplate usable capacity of the bank, which for the four-unit Pylontech US3000C installation is 12,780Wh at 90 percent DoD.
SoH = (E_delivered_full_to_cutoff / C_nameplate_usable) x 100%
Example at year 3:
E_delivered  = 11,500Wh measured from VRM discharge event

C_usable     = 12,780Wh nameplate

SoH = (11,500 / 12,780) x 100% = 90.0%
A SoH above 90 percent indicates the bank is performing within its expected degradation envelope for its cycle count at 38.5 percent daily DoD. A SoH below 80 percent is the end-of-life threshold at which the bank’s reduced autonomy becomes operationally significant and replacement planning should begin.
Cell voltage spread at the top of charge is an early warning indicator that provides SoH information between annual capacity calculations. A healthy LiFePO4 bank with well-matched cells shows a cell voltage spread below 20 millivolts between the highest and lowest cell at full charge. A spread above 50 millivolts at full charge indicates that one or more cells are diverging from the pack, either through accelerated capacity loss in a weak cell or through a developing connection resistance issue at a cell terminal.
The Pylontech BMS reports individual cell voltages to the Cerbo GX, which logs them in the VRM data. Reviewing the maximum cell voltage spread at full charge quarterly is the most sensitive early warning available for developing cell imbalance without a dedicated battery analyser.
SoH Monitoring Schedule:
Annual SoH calculation -> compare VRM discharge energy to nameplate usable capacity

Quarterly cell spread review  -> maximum spread at full charge: <20mV healthy, >50mV investigate

Monthly full charge check -> confirm absorption reached and current tapered to C/20

BMS balancing verification -> confirm passive balancing active during absorption on Cerbo GX

End-of-life threshold -> SoH below 80% triggers replacement planning

Warranty claim trigger -> SoH below 80% within 10-year calendar warranty period
Commissioning Documentation
The commissioning documentation package is the set of records produced during and immediately after the commissioning sequence that establishes the verified baseline state of the system at the point of handover. It is the evidence base for warranty claims when a component fails within its warranty period, the reference document for any technician who services the system after the original installer, and the only record that allows a fault condition to be distinguished from a design error when the system behaves unexpectedly twelve months after installation.
The as-built wiring diagram shows every cable run in the system with its actual cross-section, every fuse and circuit breaker with its actual rating, every component with its model number and serial number, and every connection point with its terminal designation. The as-built diagram must reflect the actual installation, not the design intent. If a cable was substituted during installation because the specified cross-section was unavailable, the as-built diagram shows the substituted cable and the substitution is noted with the reason. An as-built diagram that shows what was intended rather than what was installed is not an as-built diagram. It is a design document that happens to resemble one.
The commissioning test results record the measured value and pass or fail outcome for each stage of the seven-stage commissioning sequence in Section 2. For Stage 2, the recorded values are the CVL, CCL, and DCL as displayed on the Cerbo GX. For Stage 3, the recorded values are the string voltage at the MPPT input terminals and the charge current at the time of measurement.
For Stage 4, the recorded values are the AC output voltage and frequency measured at the distribution board incomer terminals. For Stage 6, the recorded transfer time measured during the generator integration test. Every measurement is recorded with the instrument used, the time of measurement, and the name of the technician who performed it.
The Cerbo GX configuration export is a file produced from the Cerbo GX settings menu that records every programmed parameter in the system: the MPPT charge profile, the Multiplus-II charge and discharge voltage settings, the AC input current limit, the VRM alert thresholds, and the BMS communication configuration. This file allows the system to be restored to its commissioning state if a configuration change produces an unintended effect.
The VRM portal credentials and system ID allow any authorised technician to access the system’s historical data remotely without requiring physical access to the installation. The system ID must be recorded in the commissioning documentation and not stored only on the original installer’s account, which may not be accessible to the client or to a subsequent service provider.
The component serial numbers and warranty registration confirmations record the serial number of every major component and confirm that the warranty has been registered with the manufacturer in the client’s name. Warranty registration in the installer’s name rather than the client’s name is a common administrative error that creates difficulties when the installer is no longer available to process a warranty claim on the client’s behalf.
Commissioning Documentation Checklist:
As-built wiring diagram -> actual cable sizes, fuse ratings, component model and serial numbers

Commissioning test results -> measured values and pass/fail for all seven stages

Cerbo GX configuration export -> all programmed parameters, exported to file at handover

VRM portal credentials -> system ID, client account login, alert configuration confirmed

Serial numbers and warranties  -> all major components registered in client's name

Storage -> one copy with client, one copy with installer, one copy on VRM
Post-Commissioning Load Profile Review
The load audit in Post #1 is an estimate constructed from nameplate power ratings, assumed usage hours, and occupancy patterns. It is the best available input for system sizing before the system exists, and it is superseded the moment the system is operating and the Cerbo GX begins logging actual energy consumption data. The post-commissioning load profile review is the process of comparing the estimate against the measurement and adjusting the system’s operating parameters and the client’s expectations to reflect what the system is actually doing.
The primary input for the review is the VRM data from the first 30 days of operation. Thirty days captures enough daily variation to distinguish between the typical daily consumption pattern and the outlier days produced by unusual occupancy, guests, or events. It also captures enough of the local weather pattern to show the difference between clear-day and overcast-day solar yield, and to establish whether the battery bank is reaching full charge on most days or falling short on a significant fraction of days.
The comparison between the Post #1 load audit estimate and the VRM 30-day average daily consumption produces one of three findings. If the actual daily consumption is below the estimate, the system is operating at a lower DoD than designed. The battery bank is cycling less deeply than specified, which extends service life beyond the projection in Post #12. No corrective action is required, but the client should be informed that the system has more reserve than they may have expected and that adding loads within the unused capacity headroom is feasible without a system upgrade.
If the actual daily consumption matches the estimate within 10 percent, the system is performing as designed. The daily DoD, the autonomy reserve, and the cycle life projection from Post #12 are all valid. No corrective action is required.
If the actual daily consumption consistently exceeds the estimate, the system is operating at a higher DoD than designed and the two-day autonomy reserve is smaller than specified. The corrective actions available are load reduction to bring actual consumption below the design estimate, battery bank expansion to increase the usable capacity and restore the designed DoD, or additional array capacity to increase the daily solar harvest and reduce the frequency of days on which the bank does not reach full charge.
Post-Commissioning Review Checklist:
VRM data collection period -> minimum 30 days before drawing conclusions

Daily consumption comparison -> actual vs Post #1 estimate, percentage deviation

Solar yield comparison -> actual vs derated array output, identify underperformance

DoD at end of day -> consistent with design at rated demand?

Full charge frequency -> battery reaching 100% SoC on clear days confirms correct sizing

Autonomy reserve check -> SoC at sunrise above 60% on typical days confirms 2-day reserve

Phantom load check -> VRM 02:00 AC load reading vs phantom load estimate

Seasonal variation note -> harmattan and rainy season yield reduction visible in 30-day window

Client handover discussion -> explain actual vs estimated, set expectations for seasonal variation
For the load audit methodology and the phantom load estimates that the post-commissioning review compares against, refer to our engineering guides on how to conduct a load audit for an off-grid solar system and understanding phantom loads and standby power in off-grid systems.
Conclusion
The fault that opened this post was not a component failure. It was a diagnostic failure. The MPPT controller that was replaced was functioning correctly. The Cerbo GX that was replaced was functioning correctly. The fault was a loose connector producing an intermittent communication loss, and a technician with a structured diagnostic framework would have found it on the first visit by following the BMS communication loss pathway in Section 4: symptom confirmed, subsystem implicated, first measurement taken at the VE.Can connector, root cause identified, corrective action applied. Four minutes on the first visit instead of three visits and two unnecessary component replacements.
The structured approach that prevents this outcome has three requirements. The commissioning sequence in Section 2 must be completed in full, because it establishes the verified baseline against which any subsequent deviation is measured. The VRM data must be reviewed regularly, because the anomalies that precede a fault condition are visible in the data before they produce a service call. And the fault diagnosis framework in Section 4 must be applied systematically, because the alternative, replacing components until the fault clears, is expensive, time-consuming, and occasionally makes the fault worse by introducing new variables into a system that was already behaving unexpectedly.
The Cerbo GX is the most valuable diagnostic tool in the installation. The VRM historical data it generates is the most valuable long-term asset the system produces. A system whose VRM data is reviewed monthly, whose commissioning documentation is complete and accessible, and whose faults are diagnosed systematically rather than reactively will serve its client reliably for the full duration of its design life. A system whose VRM data is never reviewed and whose faults are cleared by component replacement will cost significantly more to operate over the same period and will produce significantly less confidence in the technology among the clients it serves.
In the next post we address system expansion: adding capacity to an existing installation, adding new loads beyond the original design envelope, and upgrading components when the system’s requirements grow beyond what the original specification can deliver.
For the component communication architecture and system parameters that the monitoring and commissioning framework in this post is built around, refer to our engineering guides on how to size and select an MPPT controller for a specific system, how to size and select an off-grid inverter — complete worked example, and battery bank sizing, configuration, and BMS selection.

I am Engr. Ubokobong Ekpenyong, a solar specialist and lithium battery systems engineer with over five years of hands-on experience designing, assembling, and commissioning off-grid solar and energy storage systems. My work focuses on lithium battery pack architecture, BMS configuration, and system reliability in off-grid and high-demand environments.