Introduction
Here is a scenario I have encountered on more than one installation. The system was designed carefully. The load audit was done properly. The battery bank was sized to deliver two days of autonomy. The solar array was sized to the worst-case monthly irradiance figure. On paper, the system should have been performing exactly as calculated. In practice, the battery was consistently hitting its low voltage cutoff six to eight hours earlier than the design predicted, every single night, without fail.
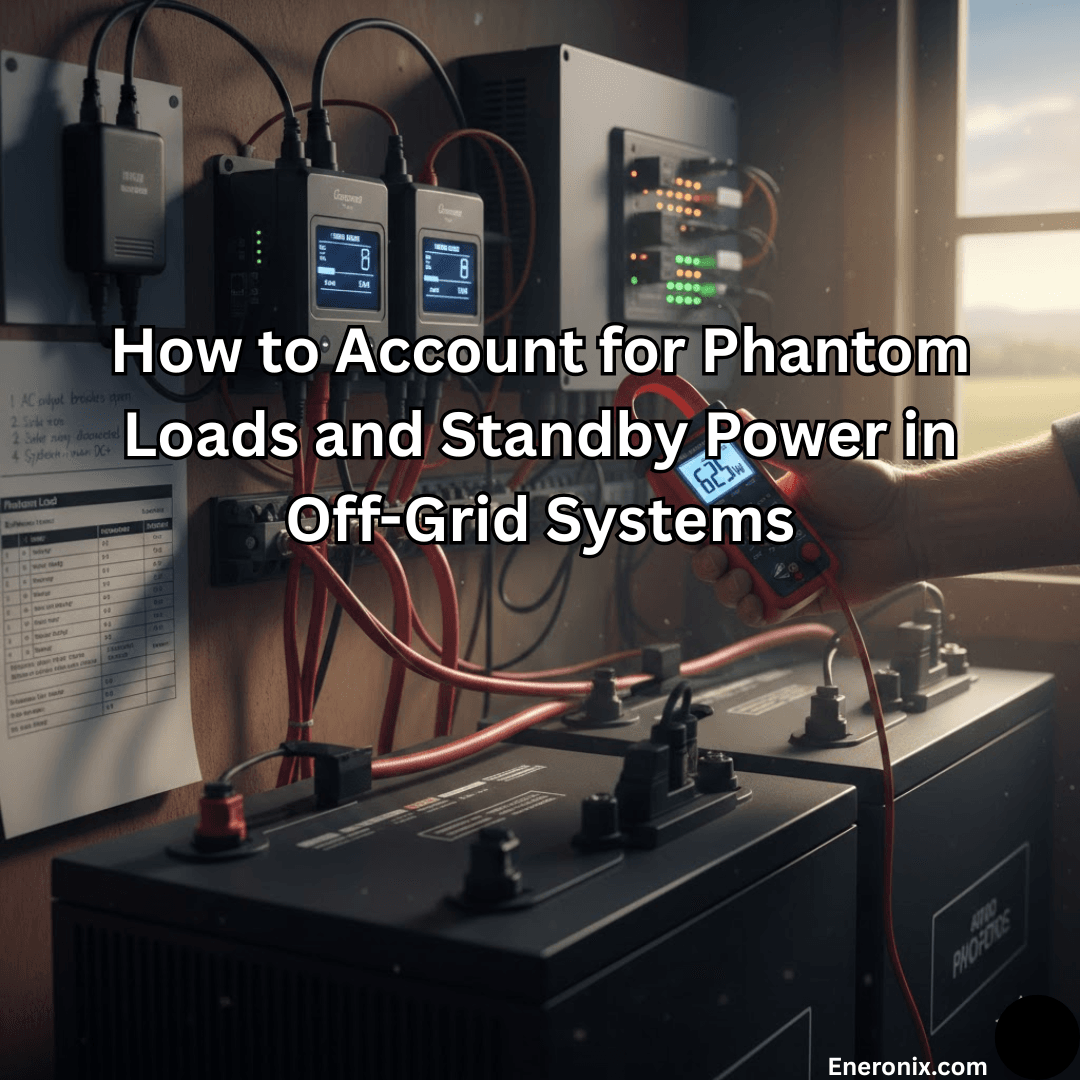
The client assumed the battery was faulty. The installer assumed the solar array was underperforming. Neither was true. When I put a clamp meter on the DC feed from the battery with every AC load switched off, the meter read 62W. That was the system’s baseline phantom draw, running continuously, 24 hours a day, 365 days a year. It had never been measured, never been accounted for, and never appeared anywhere in the original load audit. At 62W continuous, the system was consuming 1,488Wh per day in phantom loads alone, nearly 25 percent of the battery’s usable capacity, before a single light was switched on.
Phantom loads are not a rounding error. They are a fixed daily energy tax on every off-grid system, and in this post I am going to show you exactly how to find them, measure them correctly, quantify their impact, and account for them properly in your energy budget before they quietly undermine an otherwise well-designed system.
What Phantom Loads Actually Are and Why They Matter
The term phantom load gets used loosely in solar energy circles, and that looseness causes problems when it comes to system design. Let me define it precisely. A phantom load is any continuous power draw that exists regardless of occupant behavior, regardless of time of day, and regardless of whether any intentional load is active. It is not a deferrable load. It is not a non-essential load that can be shed during low battery conditions. It is a fixed background draw that runs as long as the equipment is powered, and in an off-grid system, that means it runs on battery power every hour of every night without exception.
This distinction matters because of how phantom loads interact with battery autonomy. Every other load category in an off-grid energy budget has some degree of flexibility. Lighting can be reduced. Appliances can be used less. Deferrable loads can be shifted to daytime solar production hours. Phantom loads have none of that flexibility. They draw what they draw, continuously, and the battery must absorb that demand on top of everything else the system is expected to supply.
The scale of the problem is consistently underestimated. On the off-grid systems I have monitored and audited, phantom loads account for between 8 and 15 percent of total daily energy consumption. On a system with a 10kWh daily energy demand, that represents between 800Wh and 1,500Wh per day of consumption that delivers no value to the occupant. Across a two day autonomy window, that phantom draw alone consumes between 1.6kWh and 3kWh of battery capacity. At 80 percent DoD on a LiFePO4 bank, recovering that capacity requires between 2kWh and 3.75kWh of additional installed battery capacity just to break even.
The reason phantom loads are so consistently missed is that they do not appear on any appliance list. Nobody installs a phantom load. It accumulates silently as equipment is added to the system over time, and without a deliberate measurement step in the load audit process, it remains invisible until the system starts underperforming.
For the full load audit methodology that phantom loads must feed into, refer to our engineering guide on off-grid load audit methodology and battery sizing.
The Inverter: Your Biggest Phantom Load Offender
If there is one phantom load source that dominates every off-grid system I have audited, it is the inverter. Not because inverter standby draw is unusually high in absolute terms, but because it runs continuously, it is almost always the largest single phantom contributor, and it is the one most installers forget to account for because they are focused on what the inverter delivers rather than what it consumes when it is doing nothing.
Every inverter has a no-load or standby power consumption figure published in its datasheet. In practice, quality hybrid and off-grid inverters in the 3kVA to 10kVA range draw between 10 and 35W continuously in standby mode, meaning the inverter is powered on, DC input is connected, but no AC loads are active.
The variation across that range is significant and is driven by several factors: the inverter’s internal power supply design, whether grid sensing circuits are active and polling for grid presence, whether generator start circuits are enabled, and the firmware version running on the unit. I have measured the same inverter model drawing 18W on one firmware version and 28W on another after an update that enabled additional grid monitoring features.
The formal expression for phantom energy contribution from any standby source is:
E_phantom = P_standby x t
Where:
E_phantom  = phantom energy consumed (Wh)
P_standby  = continuous standby power draw (W)
t = time period in hours (24h for daily calculation)
Applying this to a realistic inverter standby draw of 25W:
E_phantom = 25W x 24h = 600Wh per day
That 600Wh is consumed every single day regardless of what the household does. On a system with a 10kWh lithium battery bank at 80 percent usable capacity, the inverter standby draw alone consumes 7.5 percent of available daily capacity before any intentional load is switched on. Over a two day autonomy window, it accounts for 1,200Wh of battery demand that was never in the original load audit.
The practical step I take on every system is to find the standby power figure in the inverter datasheet before the load audit is finalized, enter it as a fixed 24 hour load in the audit table, and treat it with the same priority as a critical load because it cannot be shed or deferred. If the datasheet figure is not available or the inverter is already installed, I measure it directly with a DC clamp meter at the battery terminals with all AC breakers open. What the meter reads at that point is the inverter’s true standby draw under real installation conditions, which is often higher than the datasheet figure due to additional sensing circuits and communication loads.
MPPT Charge Controller Quiescent Draw
The MPPT charge controller is the phantom load source that gets overlooked most consistently after the inverter, and on installations with multiple charge controllers or large multi-input MPPT units, the cumulative draw is significant enough to meaningfully affect battery autonomy calculations.
Every MPPT charge controller has two distinct operating states that produce different quiescent draws, and both need to be accounted for separately in the phantom load budget. During daylight hours when the array is producing above the controller’s wake threshold, the MPPT is in active tracking mode. In this state, the controller’s processing circuits, display, communication interfaces, and tracking algorithms are all active, drawing typically between 5 and 15W depending on the model and the number of active inputs. This draw is partially offset by the fact that the array is producing during this period, but it still represents a real energy cost that reduces net charging efficiency.
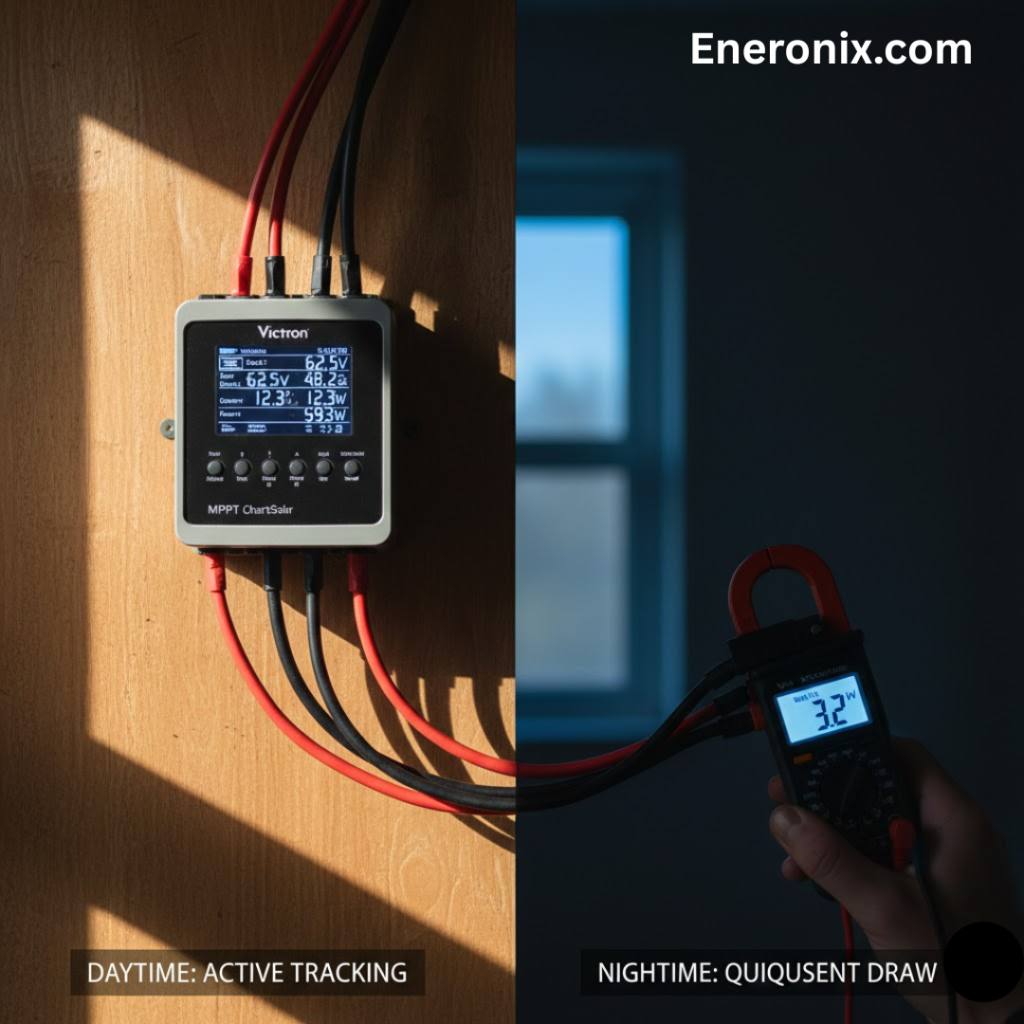
During nighttime hours, a well-designed MPPT charge controller enters a sleep or hibernate mode when array voltage drops below the wake threshold. In sleep mode, quiescent draw typically falls to between 1 and 5W as the controller maintains only its essential monitoring and communication circuits. Some older or lower-quality controllers do not implement a proper sleep mode and continue drawing their full daytime quiescent current overnight, which I have confirmed by measurement on several installations using budget charge controllers.
The daily phantom energy contribution from a single MPPT controller requires a blended calculation across its two operating states:
E_mppt = (P_day x t_day) + (P_night x t_night)
Where:
E_mppt = total daily MPPT phantom energy (Wh)
P_day = active tracking quiescent draw (W)
t_day = daily sunlight hours (h)
P_night = sleep mode quiescent draw (W)
t_night = overnight hours = 24 minus t_day (h)
Applying this to a typical installation with 6 peak sun hours and a controller drawing 10W during tracking and 3W overnight:
E_mppt = (10W x 6h) + (3W x 18h) = 60 + 54 = 114Wh per day
On a system with two MPPT charge controllers, that figure doubles to 228Wh per day from charge controller quiescent draw alone. This belongs in the phantom load section of every load audit table as a measured, documented line item.
BMS Quiescent Current: The Hidden Background Draw
The BMS is the phantom load source that virtually no installer accounts for, and I understand why. The draw is small in absolute terms, the BMS is rarely listed as a load in any system documentation, and most system designers think of it as part of the battery rather than as a separate energy-consuming device. But on a 48V system with an active CAN bus and cell-level monitoring running continuously, BMS quiescent draw is real, measurable, and worth including in any honest phantom load budget.
A standalone BMS in a DIY lithium battery build draws between 0.5W and 3W continuously to power its cell voltage measurement circuits, temperature monitoring inputs, balancing logic, and protection switching hardware. The variation across that range is driven primarily by the number of cell groups being monitored, the balancing current when passive balancing is active, and the communication interfaces that are enabled. A basic 8-cell BMS with no active communication draws closer to 0.5W. A 16-cell BMS with CAN bus, RS485, and Bluetooth all active simultaneously can approach 3W or above.
On systems using packaged lithium batteries with integrated BMS units, the quiescent draw is higher. A 48V lithium battery with an integrated BMS, an active CAN bus connection to the inverter, and a Bluetooth monitoring interface enabled can draw between 3W and 6W continuously. Across a 24 hour period that represents between 72Wh and 144Wh of phantom consumption per battery unit. On a system with two battery units in parallel, that doubles to between 144Wh and 288Wh per day from BMS quiescent draw alone.
The measurement approach is the same as for any other phantom load source. I measure at the DC terminals of each battery unit individually with a precision clamp meter or a battery monitor that reports idle current, and I record the figure as a fixed continuous load in the audit table. It is a small number, but phantom load accounting is fundamentally about accumulation, and leaving out small contributors is exactly what produces the gap between calculated and actual system performance.
BMS Quiescent Draw Reference:
Basic 8-cell BMS, no comms active -> 0.5W to 1W
16-cell BMS with CAN + RS485 + BT -> 2W to 3W
Packaged 48V battery, CAN bus active -> 3W to 6W
Two packaged batteries in parallel -> 6W to 12W (144 to 288Wh/day)
For a detailed understanding of how BMS communication interfaces contribute to quiescent draw and how CAN bus activity affects idle current, refer to our technical analysis of BMS-inverter communication protocols in modern solar systems and our field guide on CAN bus physical layer battery communication failures.
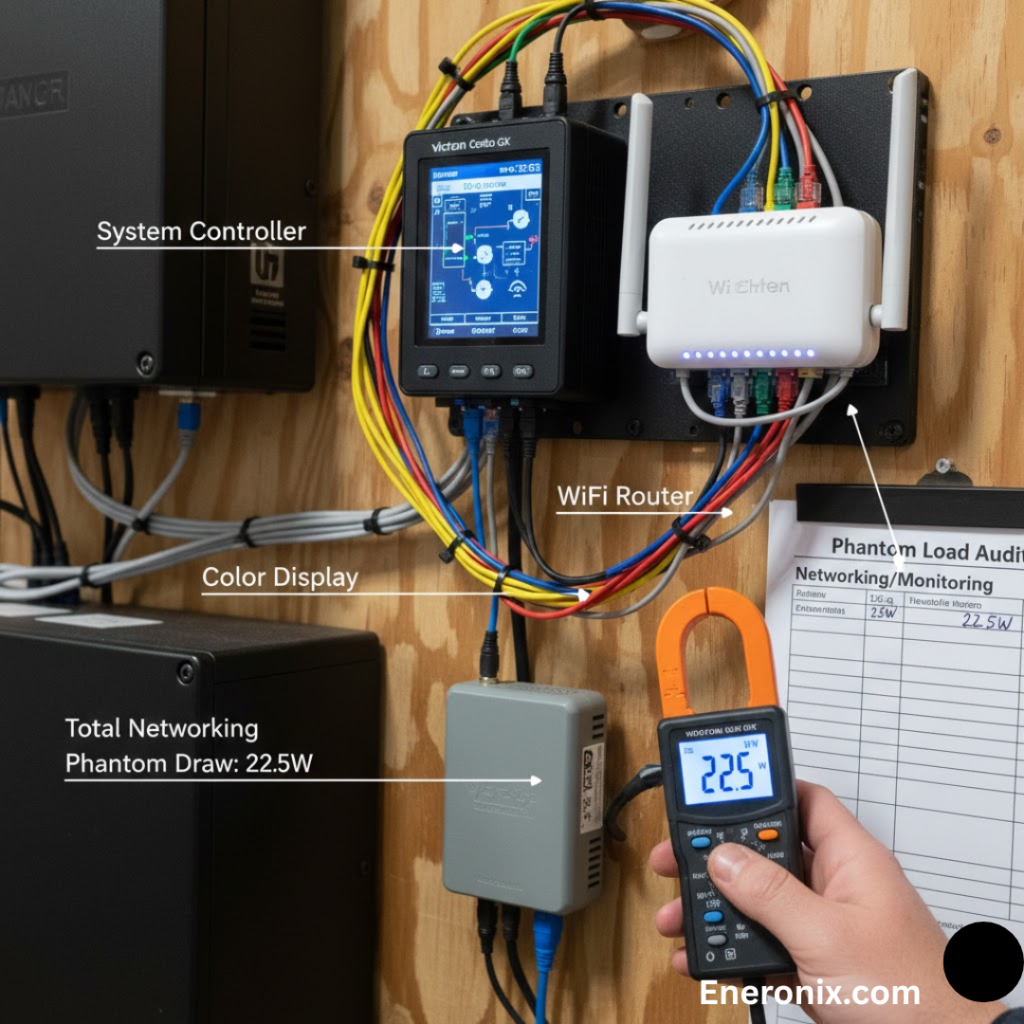
Networking, Monitoring, and Data Equipment
There is a direct relationship between system sophistication and phantom load accumulation that I want to make explicit, because it catches experienced installers off guard more often than it catches beginners. The more capable and well-monitored an off-grid system is, the more networking and data equipment it tends to carry, and every piece of that equipment draws power continuously regardless of whether anyone is actively using it.
A basic system monitoring setup on a modern off-grid installation might include a Victron Cerbo GX or equivalent system controller, a color control display panel, a Wi-Fi router for remote monitoring access, and a cellular data modem for sites without fixed internet connectivity. Each of these devices has its own continuous draw. A Cerbo GX draws approximately 3 to 4W continuously. A color control display adds another 2 to 3W. A mid-range Wi-Fi router draws 5 to 10W. A cellular modem draws 3 to 8W depending on signal strength and data activity. Together, this basic monitoring stack accumulates between 13 and 25W of continuous phantom draw, contributing between 312Wh and 600Wh per day of phantom energy consumption.
On more sophisticated installations with additional components, the figure climbs further. A system with a Raspberry Pi running Venus OS, an additional network switch, a security camera system drawing from the inverter output, and a weather station feeding data to the monitoring platform can easily push the networking and monitoring phantom draw to 35 to 50W continuous, representing 840Wh to 1,200Wh per day of non-productive energy consumption.
The audit methodology I apply to networking and monitoring equipment is identical to what I use for every other phantom load category. I measure each device individually at its power input with a plug-in energy monitor or clamp meter, record the continuous draw, and enter it as a fixed 24 hour load in the phantom load section of the audit table. I do not estimate from datasheets for this category because networking equipment draw varies significantly with actual usage, signal conditions, and connected device count. Measurement is the only reliable method.
What this category reveals more clearly than any other is that phantom load management is an ongoing discipline, not a one-time calculation. Every time a new monitoring device, router upgrade, or remote access system is added to the installation, the phantom load budget needs to be revisited and the battery autonomy recalculated. Systems that were correctly sized at commissioning can drift into undersizing over time simply through the gradual accumulation of additional monitoring equipment that nobody tracked.
Thermal Management and Temperature Compensation Circuits
Thermal management is the phantom load category that varies most dramatically with installation environment, and it is the one most likely to be completely absent from a load audit designed in one climate and deployed in another. Active thermal management systems, battery enclosure heating elements, and temperature-controlled ventilation fans all draw power continuously or semi-continuously depending on ambient conditions, and in climates where temperature extremes are a real operational concern, this category can represent a significant and seasonally variable phantom load.
Battery heating is the most impactful thermal management phantom load in cold climate installations. LiFePO4 cells cannot be charged safely below 0 degrees Celsius, and their discharge performance degrades significantly below 10 degrees Celsius. Off-grid installations in highland areas, cold arid regions, or any environment where nighttime temperatures regularly fall below 5 degrees Celsius require active battery heating to maintain cell temperature within the safe operating window. Battery heating elements in enclosed battery compartments typically draw between 20 and 50W continuously during cold nights, and on a system where temperatures drop below freezing for 10 to 12 hours per night, the daily phantom energy contribution from heating alone is between 200Wh and 600Wh.
Enclosure ventilation fans add a smaller but consistent phantom draw on installations where battery compartments are subject to high ambient temperatures. A thermostatically controlled fan running at 10W for 8 hours per day during hot season contributes 80Wh per day of phantom consumption that would not appear at all during cooler months. On systems in tropical climates where battery enclosures are exposed to direct solar radiation or installed in poorly ventilated spaces, fan runtime can extend to 16 hours or more per day during peak summer months.
The correct approach for thermal management phantom loads is to calculate a worst-case seasonal figure and a best-case seasonal figure separately, and to size the battery bank and solar array to the worst-case scenario. A system that is comfortable in the dry season but starved for battery capacity during a cold night or a hot season with prolonged fan runtime has not been properly audited for thermal phantom loads.
The Correct Phantom Load Measurement Methodology
Everything covered in the previous five sections is only useful if you measure it correctly. The measurement methodology for phantom loads is simple in principle but consistently executed incorrectly in practice, and the error almost always comes from measuring at the wrong point in the system. If you are measuring phantom loads at the AC output of the inverter, you are missing a significant portion of what you need to account for.
The correct measurement point is the DC side of the system, specifically at the battery output terminals or on the main DC conductor between the battery bank and the system busbars. At this point, the clamp meter captures every draw that the battery is supplying, including the inverter’s own internal consumption, the MPPT charge controllers, the BMS quiescent current, all DC-powered monitoring equipment, and any thermal management systems connected directly to the DC bus. An AC-side measurement captures only what passes through the inverter’s DC to AC conversion stage, which misses every DC-side phantom load entirely.
The step-by-step procedure I follow on every system audit is as follows. First, open all AC output breakers so no AC loads are active. Second, confirm that the solar array is disconnected or that it is nighttime so no charging current is flowing. Third, allow the system to settle for 60 seconds so any startup transients from the inverter’s internal circuits have stabilized. Fourth, clamp the meter onto the main DC positive conductor from the battery and record the reading. This is your total system phantom draw under real operating conditions.
Total Phantom Draw (W) = DC clamp meter reading with all AC loads disconnected
and no charging current flowing
Once you have the total figure, disaggregate it by switching off individual phantom load sources one at a time and recording the drop in current after each switch-off. This gives you a breakdown of each contributor’s share of the total phantom draw, which is essential for targeted reduction efforts.
Phantom Load Measurement Checklist:
1. All AC output breakers open
2. Solar array disconnected or measurement taken at night
3. System settled for minimum 60 seconds
4. Clamp meter on main DC positive conductor from battery
5. Record total phantom draw in watts
6. Switch off individual sources sequentially, record each drop
7. Verify sum of individual contributions matches total reading
8. Enter total as fixed 24h load in audit table
For the audit table structure that phantom loads feed into, refer to our full engineering methodology on off-grid load audit methodology and battery sizing.
Phantom Load Reduction Strategies
Measuring phantom loads accurately is the first discipline. Reducing them deliberately is the second, and the financial and autonomy case for doing so is stronger than most installers realize. Phantom load reduction is not an aesthetic preference for lean system design. It is a direct lever on battery bank sizing, solar array sizing, and long-term system cost, and the math behind it is straightforward enough to make the case concisely.
The formal relationship between phantom load reduction and battery bank savings is:
Battery Savings (Wh) = Phantom Reduction (W) x 24h x Days of Autonomy / DoD
Where:
Phantom Reduction = reduction in continuous phantom draw achieved (W)
Days of Autonomy = design autonomy period (days)
DoD = maximum depth of discharge as a decimal (e.g., 0.80)
Applying this to a realistic reduction scenario. A system audit reveals 80W of total phantom draw. Through inverter standby optimization, disabling unused communication interfaces, and replacing a legacy router with a low-power alternative, the phantom draw is reduced to 30W. The reduction is 50W continuous:
Battery Savings = 50W x 24h x 2 days / 0.80 = 3,000Wh = 3kWh
That is a 3kWh reduction in required battery bank capacity driven entirely by phantom load management, with no change to any intentional load in the system. At current lithium battery pricing, that represents a meaningful direct cost saving before the solar array resizing benefit is even considered.
The practical reduction strategies I apply in order of impact are as follows. First, optimize inverter standby settings. Many modern hybrid inverters have a configurable standby power mode that reduces internal draw during periods of low or zero load. Enabling this mode on inverters that support it can reduce standby draw by 5 to 15W without any operational impact.
Second, audit and disable unused communication interfaces on every device in the system. A BMS with Bluetooth, CAN bus, and RS485 all active simultaneously draws more quiescent current than the same BMS with only the active communication protocol enabled. Disabling unused interfaces is a zero-cost phantom reduction that takes minutes to implement.
Third, implement a nighttime phantom load cutoff strategy using a programmable relay or smart load controller. Non-essential phantom loads including Wi-Fi routers, remote monitoring displays, and cellular modems do not need to run between midnight and 6am on most off-grid residential installations. Switching these loads off during that window on a system with 35W of networking phantom draw saves 210Wh per night, which across a two day autonomy window represents 420Wh of recovered battery capacity.
Integrating Phantom Loads Into the Energy Budget
Everything measured and calculated across the previous eight sections needs to land in one place: the load audit table. Phantom loads do not get a separate document or a footnote at the bottom of the energy budget. They get their own dedicated rows in the same audit table as every other load in the system, treated with the same rigor, and carrying the same weight in the final daily energy demand figure that feeds battery and solar array sizing.
The way I integrate phantom loads into the audit table is to create a dedicated phantom load section at the bottom of the table, below all intentional loads, with each phantom source listed as its own line item. Every entry in this section carries a duty cycle of 100 percent and a daily operating time of 24 hours, because that is the reality of what these draws represent. There are no assumptions about usage patterns, no diversity factors applied, and no seasonal adjustments except for thermal management loads where a worst-case seasonal figure is used.
Here is what the phantom load section of a real audit table looks like integrated into the full load picture:
| Load | Measured W | Duty Cycle | Daily Hours | Daily Wh |
| Refrigerator | 150W | 35% | 24h | 1,260Wh |
| Water Pump | 400W | 100% | 3h | 1,200Wh |
| LED Lighting | 120W | 100% | 5h | 600Wh |
| Ceiling Fan | 55W | 100% | 8h | 440Wh |
| Phantom: Inverter Standby | 25W | 100% | 24h | 600Wh |
| Phantom: MPPT Controller | 10W | 100% | 24h | 240Wh |
| Phantom: BMS Quiescent | 4W | 100% | 24h | 96Wh |
| Phantom: Networking/Monitor | 20W | 100% | 24h | 480Wh |
| TOTAL | 4,916Wh |
The phantom load section adds 1,416Wh to the daily energy demand figure in this example, which represents 29 percent of the total daily consumption. That is not a rounding error. That is a design input that changes the battery sizing calculation, the solar array sizing calculation, and the system cost estimate in a meaningful way.
Once the total daily energy demand including phantom loads is established, the correction for inverter efficiency is applied, and the corrected figure feeds directly into the battery capacity equation. For the complete sizing methodology that follows this audit, refer to our engineering guide on off-grid load audit methodology and battery sizing and our post on peak load vs average load in off-grid system design. Phantom loads are not optional inputs. They are part of the system’s real energy demand, and any audit that omits them is an incomplete audit.
Conclusion
Phantom loads are not a design afterthought. They are a fixed, non-negotiable component of your system’s daily energy demand, and every watt of unaccounted phantom draw compounds across your days of autonomy in ways that quietly but consistently undermine system performance. The 8 to 15 percent daily energy tax that phantom loads represent on most off-grid systems is large enough to shift battery sizing calculations, change solar array requirements, and explain the gap between a system that was designed correctly and a system that actually performs correctly.
The discipline required to account for phantom loads properly is not complicated. It requires a clamp meter, a systematic measurement procedure, and the commitment to enter every measured phantom draw as a dedicated line item in the load audit table rather than treating it as a background noise figure that will average out over time. It will not average out. It will accumulate, every hour of every day, for the life of the system.
What I have covered in this post, from inverter standby draw through MPPT quiescent current, BMS background consumption, networking equipment, thermal management loads, and reduction strategies, represents the complete phantom load accounting methodology I apply on every system I design and audit. None of it is theoretical. All of it is measurable, all of it is quantifiable, and all of it belongs in your energy budget before a single battery cell or solar panel is specified.
Phantom Load Accounting Summary:
Inverter standby -> 10 to 35W continuous (largest single contributor)
MPPT quiescent -> 5 to 15W day, 1 to 5W night
BMS quiescent -> 0.5 to 6W depending on comms active
Networking/monitoring -> 13 to 50W depending on equipment stack
Thermal management -> 0 to 50W seasonal (heating/cooling)
Measure at DC bus, not AC output — enter all as 24h fixed loads
In the next post in this series we move from energy budgeting into solar array sizing, examining exactly how to size a solar array for an off-grid lithium battery system using the daily energy demand figure we have now built correctly across the first three posts in this cluster. You can also revisit the foundation of this series in our engineering guide on off-grid load audit methodology and battery sizing.

I am Engr. Ubokobong Ekpenyong, a solar specialist and lithium battery systems engineer with over five years of hands-on experience designing, assembling, and commissioning off-grid solar and energy storage systems. My work focuses on lithium battery pack architecture, BMS configuration, and system reliability in off-grid and high-demand environments.