I get a lot of question on the subject What Voltage Is 50% for a Lithium Battery? Well if you just want the number, here it is.
What Voltage Is 50% for a Lithium Battery?
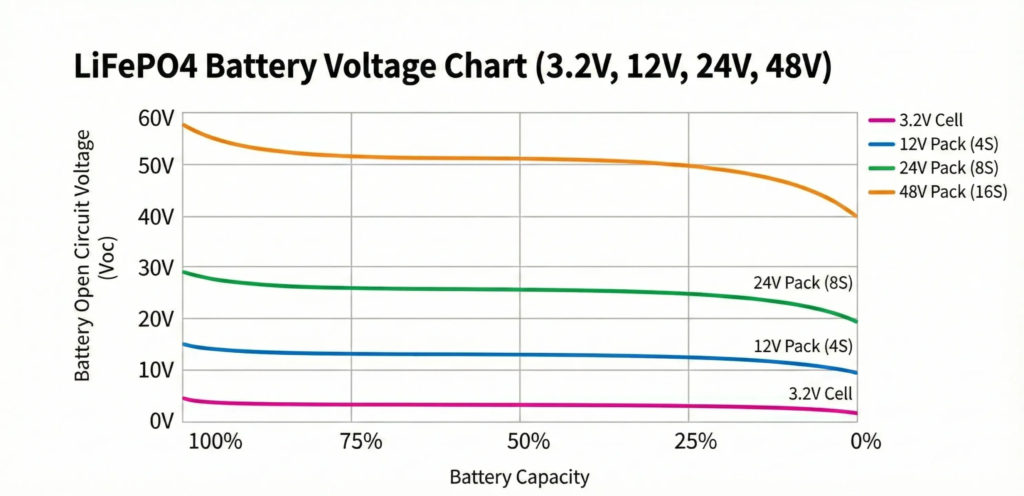
For a LiFePO4 battery at 50% state of charge, the resting open-circuit voltage is approximately:
Single cell: 3.13 to 3.17V, with 3.15V as a good midpoint estimate.

12V pack (4 cells in series): approximately 12.6V

24V pack (8 cells in series): approximately 25.2V

48V pack (16 cells in series): approximately 50.4V
Now before you go checking your battery against those numbers, there is one thing you need to know first. These are resting voltages. That means the battery has been sitting quietly with no loads running and no charging happening for at least 30 minutes. If your inverter is on, if your panels are charging the battery, or if you just finished running a heavy load, the voltage you measure right now will not match these figures. We will explain exactly why that is in a later section.
That distinction matters a lot more with LiFePO4 than with most other battery types, and it is one of the main reasons people are confused by the percentage reading on their inverter display. The number on the screen and the actual state of the battery are often two very different things.
Here is a line worth keeping in mind throughout this post: for LiFePO4, voltage is a state indicator, not a state measurement. It gives you a rough idea of where you are. It does not tell you precisely how much energy is left in the battery. The flat voltage curve that defines this chemistry makes voltage-based SOC estimation genuinely unreliable across most of the battery’s usable range.
What that means, why it happens, and what you should actually use to track your battery state accurately is what the rest of this post is about.
This post is part of the Eneronix lithium battery cluster. For the complete foundation on how lithium batteries work including voltage, charging, lifespan, and real-world performance, start with the pillar: Lithium Battery Basics: Lifespan, Voltage, Charging & Real-World Performance Explained
The Voltage vs SOC Reference Table
Here is the full resting open-circuit voltage reference for LiFePO4 batteries across the four most common system configurations. These figures represent midpoint estimates at each SOC level under standard conditions — 25°C, no load, no charging, battery at rest.
| SOC | Per Cell | 12V System | 24V System | 48V System |
| 100% | 3.40 to 3.45V | 13.6V | 27.2V | 54.4V |
| 90% | 3.35V | 13.4V | 26.8V | 53.6V |
| 80% | 3.30V | 13.2V | 26.4V | 52.8V |
| 70% | 3.25V | 13.0V | 26.0V | 52.0V |
| 60% | 3.22V | 12.9V | 25.8V | 51.6V |
| 50% | 3.15V | 12.6V | 25.2V | 50.4V |
| 40% | 3.10V | 12.4V | 24.8V | 49.6V |
| 30% | 3.05V | 12.2V | 24.4V | 48.8V |
| 20% | 3.00V | 12.0V | 24.0V | 48.0V |
| 10% | 2.95V | 11.8V | 23.6V | 47.2V |
| 0% | 2.50V | 10.0V | 20.0V | 40.0V |
A few important things to note about this table before you start comparing it against your battery readings.
First, the per-cell column is the most important one. Every system voltage is simply a multiple of the per-cell voltage. A 12V pack has 4 cells in series so you multiply by 4. A 24V pack has 8 cells so you multiply by 8. A 48V pack has 16 cells so you multiply by 16. If you ever have a battery voltage that does not seem to match the table, divide the pack voltage by the number of cells first and compare the per-cell figure instead.
Second, these numbers will vary slightly between manufacturers. Different cell suppliers calibrate their chemistry slightly differently, and a battery that has been through hundreds of cycles will have a slightly shifted curve compared to a brand new one. Think of this table as a reliable reference guide, not an exact measurement instrument. A reading that is 0.1V away from the table value is not a problem. A reading that is 0.5V or more away from what you expect at a given SOC is something worth investigating.
Third, look at the gap between 80% and 20% in the per-cell column. From 80% down to 20%, the voltage only moves from 3.30V to 3.00V. That is just 0.30V per cell across 60% of the battery’s usable capacity. On a 48V system that becomes only 4.8V of total spread across the middle 60% of your battery. This is the flat plateau problem and it is why your inverter percentage display can be so unreliable in that range. We will go into this in detail in the next section.
If you want to put these numbers to work immediately and size a battery bank that will actually deliver what you need at different load levels and autonomy requirements, the LiFePO4 Battery Bank Calculator on the Eneronix resources page does exactly that. You enter your daily load, depth of discharge, and autonomy days and it gives you the bank configuration, usable kWh, and runtime at different discharge rates.
Why the Middle of the Chart Tells You Almost Nothing
Look at the table from the previous section again. Specifically, look at what happens between 70% and 40% state of charge on a 48V system.
At 70%, the resting voltage is approximately 52.0V. At 40%, it is approximately 49.6V. That is a difference of just 2.4V across 30 percentage points of capacity. On a per-cell basis that is only 0.15V. On a system that regularly sees voltage fluctuations from load changes, temperature shifts, and measurement timing, that 2.4V gap is essentially invisible.
This is the flat plateau problem, and it is the single most important thing to understand about reading LiFePO4 voltage.
The chemistry of lithium iron phosphate is designed to maintain a stable output voltage for as long as possible during discharge. This is actually one of the reasons LiFePO4 is so good for solar and inverter applications. Your appliances get consistent voltage all the way through the discharge cycle rather than the sagging performance you get from lead-acid batteries as they drain. The flat curve is a feature.
But that same feature makes it almost impossible to read state of charge accurately from voltage in the middle range. A battery at 65% and a battery at 45% will show nearly the same resting voltage. If your inverter is reading both of them as 50%, it is not being dishonest. It genuinely cannot tell the difference from voltage alone.
Here is a way to think about it. Imagine trying to guess how much petrol is in a car by listening to the engine sound. The engine runs the same whether the tank is three quarters full or one quarter full. You only get a clear signal when the tank is almost empty and the engine starts to sputter. LiFePO4 voltage works the same way. It holds steady through most of the discharge cycle and only gives you a clear signal when you are close to the top or close to the bottom.
What this means practically is that any percentage reading your inverter shows you while the battery is between about 20% and 80% should be treated as a rough estimate rather than a precise figure. Some inverters are better than others at compensating for this, particularly those with proper BMS communication via CAN bus. But most of the inverters commonly sold in Nigeria use simple voltage lookup tables, and in the flat plateau region those tables cannot give you accuracy better than plus or minus 15 to 20 percentage points.
So if your inverter says 55% and the battery is actually at 38%, the inverter is not broken. It is doing the best it can with voltage-only information on a chemistry that is specifically designed not to change voltage much in that range.
The practical takeaway is simple. In the 20 to 80% range, trust your voltage reading for rough guidance only. If you need to know precisely how much energy your battery has left, you need a tool that counts energy in and out rather than one that estimates from voltage. We will cover that in Section 6.
The Three Zones of the Discharge Curve

Even though LiFePO4 voltage is unreliable in the middle range, the discharge curve is not completely flat from top to bottom. It has three distinct zones, and each one behaves very differently. Understanding where those zones are helps you interpret what your battery is doing at any given moment.
The Top Zone — 80% to 100%
This one surprises a lot of people. When you first charge a LiFePO4 battery to full and then start using it, the voltage drops relatively quickly in the first few percent of discharge. A battery that was sitting at 54.4V when fully charged on a 48V system might drop to around 52.8V after using just 10 to 15% of its capacity.
This does not mean something is wrong. It is simply how the chemistry behaves at the top of its range. The voltage at full charge is slightly elevated above where the cells naturally want to rest, and it settles down quickly once you start drawing current. If you see your inverter percentage drop from 100% to 80% faster than you expected shortly after a full charge, this is almost certainly why.
The practical implication is that you should not panic if the percentage falls quickly right after charging. It is not a sign of capacity loss or a weak cell. It is just the top zone of the discharge curve doing what it always does.
The Flat Plateau — 20% to 80%
This is the long middle section we discussed in the previous section. Voltage barely moves. Your appliances run consistently. The battery is delivering energy at a stable rate. From a performance standpoint this is the best part of the discharge cycle. From a monitoring standpoint it is where voltage tells you the least.
Most of your daily energy use happens here. If your system is properly sized and you are following the 80/20 charging rule, your battery spends the majority of its operating life cycling within this zone. The flat plateau is where LiFePO4 earns its reputation for stable, reliable performance.
The Bottom Cliff — 0% to 20%
This is where things get steep, and it is where most unexpected shutdowns happen.
Once the battery drops below about 20% state of charge, the voltage starts falling more rapidly. The cells are running low on available lithium ions and the chemistry starts to struggle. On a 48V system you are looking at voltages dropping below 48V and heading toward the BMS cutoff threshold.
Here is the important nuance that a lot of articles get wrong. The BMS does not cut off the moment you enter the bottom zone. There is still usable energy available from 20% down to about 10%. The BMS cutoff typically activates when any individual cell drops to around 2.5 to 2.8V, which on a 16-cell 48V pack corresponds to a pack voltage of roughly 40V to 44.8V. The cutoff is there to protect the weakest cell from going below its safe minimum, not to mark an absolute empty point for the whole pack.
What this means in practice is that a sudden shutdown does not always mean the battery is completely empty. It means one cell hit the floor before the others, which brings us back to the cell imbalance problem. A well-balanced pack will have all cells reaching the cutoff threshold at roughly the same time, giving you more usable capacity before the BMS acts. A pack with developing imbalance will shut down earlier because the weakest cell gets there first.
The other thing to watch for at the bottom zone is how rapidly the voltage falls once you enter it. On a healthy battery the drop is steep but smooth. On a battery with a significantly degraded cell, the voltage can plunge suddenly and the BMS trip can feel almost instantaneous. If your system is cutting off very abruptly at what seems like a moderate state of charge, that is one of the clearest signs that cell imbalance has developed to a point where it needs attention.
For a deeper look at what that abrupt cutoff means and how to diagnose it, Why Your Battery Dies Faster Than Expected walks through exactly this scenario from the user’s perspective.
Resting Voltage vs Under-Load Voltage vs Charging Voltage
One of the most common mistakes people make when trying to read their battery state of charge is measuring voltage at the wrong moment. There are three completely different voltage readings you can get from the same battery depending on what it is doing, and only one of them will match the SOC table from Section 2.
Resting Voltage
Resting voltage, also called open-circuit voltage or OCV, is what you measure when the battery has been sitting quietly with no loads and no charging for a period of time. This is the reading that corresponds to the SOC table. When you see figures like 50.4V equals 50% on a 48V system, those figures assume a resting battery.
The minimum rest period is 30 minutes. That is enough for most situations where the battery has been under a moderate load. But if the battery has just come off a heavy discharge, running a 3kW or 5kW inverter at high load for several hours, it may need one to two hours of rest before the voltage fully relaxes to its true open-circuit value. The cells need time to chemically equilibrate after a period of heavy current flow, and until that equilibration is complete the voltage you read will be slightly lower than the true resting value.
Similarly, if the battery has just finished charging, there is a surface charge effect where the cells hold a slightly elevated voltage that has not yet settled into the stable resting state. Wait the same 30 minutes to two hours before trusting the reading against the table.
The practical procedure for an accurate resting voltage check is straightforward. Turn off your inverter. Disconnect or switch off your solar charge controller. Wait at least 30 minutes, longer if the battery has been under heavy use. Then measure the voltage with a multimeter across the battery terminals and compare against the table.
Under-Load Voltage
When your inverter is running and drawing current from the battery, the voltage you see on the display is not the resting voltage. It is the voltage under load, and it will always be lower than the true resting voltage because of a phenomenon called voltage sag.
Voltage sag happens because every battery has internal resistance. When current flows through that resistance, it causes a voltage drop proportional to the current being drawn. The higher the load, the bigger the voltage drop, and the lower the displayed voltage compared to the true battery state.
Here is a realistic example. A 48V battery pack sitting at a true resting voltage of 51.6V, which corresponds to approximately 60% SOC on the table, might show only 49.5V on the inverter display when a 2.5kW load is running. If your inverter uses that 49.5V to estimate SOC from a voltage lookup table, it might show 25% or 30% on the screen. The battery is actually at 60%. The inverter is not lying. It is just reading a voltage that has been pulled down by the load and has no way of knowing that.
This is one of the most common sources of confusion for people running solar systems in Nigeria. The percentage drops sharply when a heavy appliance comes on, then bounces back up when it switches off. That is not the battery rapidly losing and regaining charge. That is voltage sag responding to changes in current draw.
Charging Voltage
When the battery is being charged, the voltage is being pushed up by the charger. A 48V battery might show 56V or 57V on the display while charging even though it is only at 70% actual state of charge. Comparing that charging voltage against the resting SOC table will tell you the battery is nearly full when it is actually not even close.
This is why charge controllers and inverters use absorption voltage and charge current as the indicators of a complete charge, not the voltage alone. A battery is truly full when it has reached the target absorption voltage and the charge current has tapered down to near zero, not when the voltage hits a particular number during the active charging phase.
The simplest rule to remember is this. The SOC voltage table is only valid for resting measurements. Any voltage reading taken while charging or discharging is a different number entirely and should be interpreted differently.
For a full breakdown of why inverter percentage displays are often wrong and what each type of wrong reading is telling you about your system, Inverter Battery Percentage Wrong? 5 Reasons and How to Fix It Fast covers every scenario with specific practical fixes.
Why Your Inverter Percentage Is Often Wrong
Now that you understand the three voltage states and the flat plateau problem, the reason your inverter percentage is often unreliable becomes very clear. It is not a defect in your inverter. It is a fundamental mismatch between how most inverters estimate state of charge and how LiFePO4 batteries actually behave.
Most inverters sold in Nigeria, including the popular hybrid models from brands like Luminous, Felicity, Deye, and Growatt, estimate battery percentage using a voltage lookup table. The inverter measures the battery terminal voltage, finds the closest match in its internal table, and displays the corresponding percentage. This approach works reasonably well for lead-acid batteries because lead-acid has a much steeper voltage curve where voltage changes meaningfully and consistently as the battery drains.
For LiFePO4 it is a different story entirely. Because of the flat plateau we discussed in Section 3, a 48V LiFePO4 battery at 70% and a 48V LiFePO4 battery at 40% might both show around 51V on the inverter display when under load. The inverter looks at 51V, checks its table, and reports a single percentage figure. But 51V could represent almost any SOC between 30% and 70% depending on the load at that moment, the battery temperature, the age of the cells, and how recently the battery was charged or discharged.
This is not a rounding error. On a bad day the inverter percentage can be off by 20 to 30 percentage points in either direction. You can see 60% on the display and the battery shuts down 20 minutes later because the actual SOC was closer to 25%. Or you can see 40% and still have four hours of runtime remaining because the actual SOC was closer to 65%. Both scenarios are real and both are caused by the same underlying problem.
There are three things that make this worse in practice.
The first is that most budget inverters measure battery voltage while the inverter is actively running loads. That means they are always reading under-load voltage rather than resting voltage. As we covered in Section 5, under-load voltage is always lower than resting voltage because of voltage sag. So the inverter is consistently working with a depressed voltage reading and consistently underestimating the true SOC.
The second is that inverters configured for lead-acid chemistry use voltage tables calibrated for that chemistry. If your inverter is connected to a LiFePO4 battery but set to lead-acid mode, the voltage-to-percentage conversion is wrong from the start. A 48V LiFePO4 battery reading 51V is at approximately 60% SOC. A lead-acid battery at 51V would be nearly full. The inverter set to lead-acid mode will show close to 100% on the display for the lithium battery.
The third is temperature. Cold cells read lower voltage than their true SOC would suggest, which causes the inverter to further underestimate remaining charge. Hot cells read slightly higher. In Nigeria’s climate the heat effect is more common than cold, and it tends to make the inverter slightly overestimate SOC, which can lead to unexpected shutdowns when the battery is not as full as the display suggested.
What to Use Instead
The accurate solution is a dedicated battery monitor that uses coulomb counting rather than voltage estimation. A coulomb counter works by measuring the actual current flowing in and out of the battery through a precision resistor called a shunt. It integrates those measurements over time to track exactly how much energy has gone in and how much has come out. Think of it as a very precise fuel gauge that measures actual flow rather than guessing from pressure.
Popular options like the Victron BMV-712 are widely available in Nigeria through solar equipment suppliers and give you a genuinely accurate state of charge reading that does not depend on voltage at all. Once you have used a proper shunt monitor, going back to a voltage-based percentage display feels like navigating with a broken compass.
If you do not have a dedicated battery monitor and need to check your battery state accurately right now, go back to the resting voltage method from Section 5. Switch everything off, wait at least 30 minutes, measure the terminal voltage with a multimeter, and compare against the table in Section 2. It is not as convenient as a live display but it will give you a much more honest picture than whatever percentage your inverter is showing while running loads.
For a full walkthrough of sizing the right battery bank for your system, the LiFePO4 Battery Bank Calculator lets you enter your daily load and see exactly how much usable energy you have at different states of charge. And if you want to design your entire system from scratch using accurate LiFePO4 parameters, the Off-Grid Solar System Sizing Calculator covers solar panels, battery bank, inverter, and MPPT in one complete pass. Both tools are free to use on the Eneronix Resources page.
Temperature, Age, and Why the Numbers Shift
The voltage table in Section 2 assumes two things that are never perfectly true in the real world. It assumes the battery is at 25°C and it assumes the battery is in good health with its original capacity intact. In practice, both of those assumptions drift over time and with conditions, and when they drift the voltage readings drift with them.
What Temperature Does to Your Readings
Cold weather and hot weather affect LiFePO4 voltage in different ways, and the mechanism matters because it explains why the effect shows up differently depending on whether you are reading resting voltage or under-load voltage.
When a battery gets cold, its internal resistance increases. This is the key mechanism. The electrolyte inside the cells becomes less conductive at lower temperatures, which means ions move more slowly between the electrodes. Higher internal resistance has two practical consequences. First, under load the voltage sags more than it would at normal temperature because the same current is now passing through a higher resistance, producing a bigger voltage drop. Second, the battery delivers less usable capacity before hitting the BMS cutoff voltage, because the increased resistance means the weakest cell hits its minimum voltage sooner under discharge conditions.
For resting voltage specifically, the effect of temperature is more moderate. A cold battery at rest will read slightly lower than the table suggests, but the error is not enormous. The bigger problem is under-load behaviour, where cold can make a battery appear significantly more depleted than it actually is while also reducing how much energy it can practically deliver.
In Nigeria, cold is rarely a serious concern. The more common problem is heat. A battery operating at 40°C or above will read slightly higher resting voltages than the table suggests, which can cause the inverter to slightly overestimate SOC. This sounds like a minor issue but it means the battery might hit the BMS cutoff sooner than the display suggested, which is the exact scenario that causes unexpected evening shutdowns on hot dry-season days.
Beyond voltage reading accuracy, heat accelerates the aging of every cell in the pack. A battery that runs hot consistently will see its usable capacity shrink faster than one operating at 25°C. As capacity shrinks, the battery spends more of its cycle at the extremes of the SOC range where the voltage changes quickly, which actually makes voltage-based SOC estimation slightly more erratic even in areas of the curve where it used to be stable.
What Battery Age Does to Your Readings
As a LiFePO4 battery ages and loses capacity through cycling and calendar aging, the voltage curve shifts. The overall shape of the curve stays broadly similar but the specific voltages at each SOC level move slightly, and the flat plateau becomes a little less flat as capacity fades unevenly across the cells.
The practical consequence is that a voltage table calibrated for a new battery becomes progressively less accurate as the battery ages. A three-year-old battery that has lost 15% of its original capacity will have slightly different resting voltages at each SOC point compared to what the table shows. The differences are not dramatic but they are real enough to matter when you are trying to interpret whether a reading of 50.0V on your 48V system means 45% or 55%.
This is one of the reasons battery monitors that use coulomb counting are so much more useful than voltage-based displays as a battery ages. The coulomb counter tracks energy flow directly and recalibrates every time the battery reaches a full charge. It does not rely on a voltage table that was written for a battery that no longer exists in its original form.
There is also a subtler effect worth knowing about. As individual cells age at slightly different rates due to minor manufacturing differences and uneven thermal conditions in the pack, the spread between cells at the same nominal SOC widens. The BMS has to work harder to keep them balanced, and in a pack with a weak BMS this imbalance accelerates the aging of the weakest cells further. This is why the same battery pack can show increasingly erratic inverter percentage readings over time even if the total capacity has not dropped dramatically yet. The cells are drifting apart and the pack-level voltage is starting to reflect the behaviour of the weakest cell more than the average of all sixteen.
The best thing you can do for both temperature and aging effects is to monitor your system properly. All the tools you need to do this are available on the Eneronix Resources page, including calculators that account for real-world depth of discharge and runtime at different loads rather than relying on nameplate figures that assume perfect conditions.
Conclusion
The voltage question that started this post has a straightforward answer: 50% state of charge on a resting LiFePO4 battery is approximately 3.15V per cell, 12.6V for a 12V system, 25.2V for a 24V system, and 50.4V for a 48V system.
But the more important answer is the one behind that answer. For LiFePO4, voltage is a state indicator, not a state measurement. It points you in the right direction but it cannot tell you precisely how much energy remains, especially in the flat plateau between 20% and 80% where most of your daily cycling happens. Temperature shifts the readings. Load shifts the readings. Age shifts the readings. And the inverter percentage display built on top of that voltage reading compounds every one of those inaccuracies.
The practical steps to take from here are simple. Use the resting voltage table in this post as your reference for spot checks. Give the battery at least 30 minutes of rest, longer after heavy use, before comparing a measurement to the table. If you need accurate live SOC tracking, invest in a dedicated shunt monitor. And configure your inverter’s charge and discharge voltage thresholds to match your battery’s actual LiFePO4 specifications, not a lead-acid profile.
Once you understand what voltage can and cannot tell you about your battery, you stop being surprised by the behaviour that confused you before. Unexpected shutdowns, percentage readings that bounce around, a display that says 60% and then goes dark twenty minutes later. All of it makes sense when you understand the flat curve and what sits underneath the number on your screen.
For a deeper look at exactly why your inverter percentage behaves the way it does, Inverter Battery Percentage Wrong? 5 Reasons and How to Fix It Fast is the right next read.
To put all of this voltage knowledge to work in a real system design, the LiFePO4 Battery Bank Calculator and the Off-Grid Solar System Sizing Calculator are both free to use on the Eneronix Resources page.
For the complete foundation on how lithium batteries work, the pillar post covers everything in one place: Lithium Battery Basics: Lifespan, Voltage, Charging and Real-World Performance Explained
Have questions about your battery readings or your system setup? Drop them in the comments below. We read every one.

I am Engr. Ubokobong Ekpenyong, a solar specialist and lithium battery systems engineer with over five years of hands-on experience designing, assembling, and commissioning off-grid solar and energy storage systems. My work focuses on lithium battery pack architecture, BMS configuration, and system reliability in off-grid and high-demand environments.