400W Solar Panel Output In Nigeria: Why Your Panel Produces Less Power
400W solar panel output in Nigeria explained with real calculations. Learn why your 400W solar panel produces 240–290W and how to size your system correctly.
On a bright sunny afternoon, your charge controller shows 280W. Maybe 310W on a good day. You call your installer. He checks the system and tells you everything is fine.
He is correct. The system is working exactly as it should.
That is the problem.
The gap between 400W and 280W is not a fault. It is not a bad panel. It is not a dishonest installer. It is physics and it applies to every solar panel installed in Nigeria, regardless of brand, price, or quality.
This article explains exactly why your 400W panel does not produce 400W solar panel output In Nigeria It shows you the numbers, the calculations, and the real output you should expect. By the end, you will understand your system better than most people who have been running solar for years.
What this article covers What the 400W rating actually means → Why STC conditions don’t exist in Nigeria → Temperature derating: the biggest loss factor → Irradiance reduction: the second loss factor → Dust, wiring, MPPT, and mismatch losses → Real output calculations for three Nigerian scenarios → Why this destroys system performance → How to design correctly from derated output
The 400W figure on your solar panel is called the watt-peak rating written as 400Wp on most datasheets. It is not a real-world output figure. It is a laboratory measurement.
Every solar panel in the world is tested under a set of controlled conditions called Standard Test Conditions STC. The 400W rating is the output the panel produces under those specific conditions, and only under those conditions.
The Three Conditions Behind the 400W Label
The STC has three requirements:
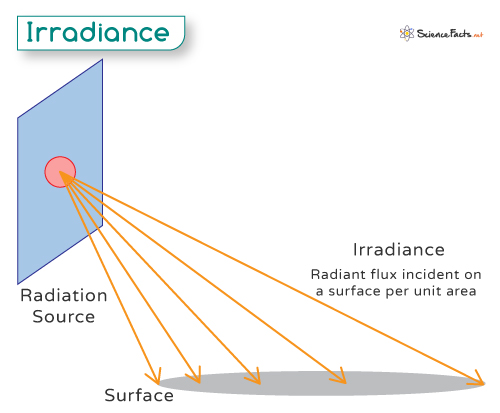
1. Irradiance of 1,000 W/m²
Irradiance is the measure of how much solar energy is hitting a surface per square metre. 1,000 W/m² is roughly equivalent to strong midday sunlight on a perfectly clear day at sea level, with the panel positioned at exactly the right angle to the sun.
In real Nigerian conditions, irradiance fluctuates constantly. Haze, dust, atmospheric moisture, cloud cover, and the angle of the sun all reduce it. On a typical Nigerian afternoon, the irradiance reaching a rooftop panel is between 700 and 950 W/m² not 1,000 W/m².
2. Cell temperature of 25°C
This is the temperature of the silicon inside the panel not the air temperature around it. To achieve 25°C cell temperature, you would need ambient air temperatures well below 20°C. That condition does not exist anywhere in Nigeria at any time of year.
In practice, solar panels heat up significantly under sunlight. Nigerian rooftop cell temperatures routinely reach 60–70°C during peak sun hours. That is 35–45°C above the STC baseline and that gap is where most of your output loss comes from.
3. AM1.5 solar spectrum
AM1.5 refers to the path length that sunlight travels through the atmosphere before reaching the panel. It is a standardised reference spectrum used in laboratory testing. For the purpose of understanding your panel’s real output, the cell temperature and irradiance conditions matter far more than this parameter.
The 400W rating was measured in a laboratory. It tells you the maximum capability of the panel under ideal conditions. It does not tell you what the panel will produce on your rooftop in Lagos, Abuja, Kano, or Port Harcourt.
Temperature The Biggest Single Cause of Output Loss
Of all the factors that reduce your panel’s output in Nigeria, temperature is the largest. It is also the most predictable because the physics behind it is well understood and the numbers are consistent.
Here is the core problem: solar panels do not like heat. The hotter a panel gets, the less electricity it produces. And in Nigeria, panels get very hot.
Why Solar Panels Heat Up Far Beyond Ambient Temperature
A solar panel converts sunlight into electricity. But it does not convert all of it. A typical monocrystalline panel converts roughly 20–22% of the sunlight hitting it into electricity. The remaining 78–80% becomes heat.
That heat has nowhere to go on a still Nigerian afternoon. There is no wind. The roof underneath the panel traps more heat from below. The panel simply gets hotter and hotter until it reaches a balance point with its environment.
This is why the panel’s internal temperature called the cell temperature is always significantly higher than the air temperature around it.
The industry measures this using a value called NOCT Nominal Operating Cell Temperature. NOCT is the cell temperature a panel reaches under a specific mild test condition: 800 W/m² irradiance, 20°C ambient temperature, and 1 m/s wind speed.
For a quality monocrystalline PERC panel, NOCT is typically 43°C. For a standard polycrystalline panel, it is typically 46°C. Nigerian rooftop conditions are harsher than the NOCT test in every way, higher ambient temperature, stronger irradiance, and little to no wind on most installations.
Worked example Abuja, March Location: Abuja | Month: March hottest month in the FCT Ambient temperature: 38°C | Irradiance: 950 W/m² | Panel: Mono PERC, NOCT = 43°C Tcell = 38 + [(43 − 20) / 800] × 950 Tcell = 38 + [23 / 800] × 950 Tcell = 38 + 0.02875 × 950 Tcell = 38 + 27.3 Tcell = 65.3°C Result: The panel is running at 65°C inside. The STC baseline is 25°C. That is a 40°C rise above the condition under which the panel was rated.
The Temperature Coefficient How Heat Eats Your Watts
Every solar panel datasheet lists a value called the temperature coefficient of power written as Pmax or γPmax. It tells you how much output the panel loses for every degree Celsius the cell temperature rises above 25°C. It is always a negative number.
Panel Type
Temperature Coefficient (Pmax)
Monocrystalline PERC
-0.34%/°C (typical)
Standard polycrystalline
-0.43%/°C (typical)
Budget / unbranded
-0.45% to -0.50%/°C
Full worked calculation 400Wp mono PERC panel, Abuja, March:
Step
Calculation
Result
Temperature rise above STC
65.3°C − 25°C
40.3°C above STC baseline
Percentage power loss
40.3 × 0.34%
13.7% power loss
Watts lost to heat
400W × 0.137
54.8W lost
Output after temperature derating
400W − 54.8W
345W
Comparison mono PERC vs polycrystalline, same conditions:
Panel Type
Rated
Cell Temp
Temp Rise
Loss %
Real Output
Mono PERC
400W
65.3°C
40.3°C
13.7%
345W
Polycrystalline
400W
68.9°C
43.9°C
17.3%
331W
Both panels are labelled 400W. On the same Abuja rooftop, on the same March afternoon, the monocrystalline panel is producing 345W and the polycrystalline panel is producing 331W and neither is producing 400W.
This is temperature derating. It happens every day. It affects every panel. And in Nigeria’s climate, it is the single largest gap between what you paid for and what you receive.
Irradiance The Second Loss Factor Nobody Mentions
Temperature gets most of the attention in solar performance discussions. Irradiance gets almost none. That is a mistake. Irradiance reduction is the second largest cause of output loss in Nigerian solar systems and unlike temperature, it varies dramatically by season, location, and time of day.
Why You Rarely See 1,000 W/m² on a Nigerian Rooftop
The STC irradiance of 1,000 W/m² is the ceiling not the average. In real Nigerian conditions, several factors reduce the irradiance reaching your panel surface below that ceiling every single day.
Condition
Irradiance Range
Clear dry season day, solar noon
850 – 950 W/m²
Harmattan haze, solar noon
600 – 750 W/m²
Partly cloudy day
400 – 700 W/m²
Overcast rainy season day
150 – 350 W/m²
Morning / late afternoon (any season)
200 – 600 W/m²
This is why we measure solar resource in peak sun hours not total daylight hours. One peak sun hour equals one hour of 1,000 W/m² equivalent irradiance. Lagos gets approximately 4.5 peak sun hours per day on average. Abuja gets 5.5. Kano gets 6.0. Port Harcourt gets 4.0.
How Irradiance Reduction Multiplies the Output Loss
Panel output scales almost linearly with irradiance at a fixed temperature. If irradiance drops to 80% of the STC reference level, output drops to approximately 80% of the temperature-derated figure. Irradiance derating applies on top of temperature derating. The two losses compound together.
Irradiance derating applied continuing from Section 2 After temperature derating: 345W (at 1,000 W/m² assumed) Actual irradiance typical clear Abuja afternoon: 850 W/m² Irradiance derating factor: 850 ÷ 1,000 = 0.85 Output after irradiance derating: 345W × 0.85 = 293W Harmattan scenario (700 W/m²): Irradiance factor: 0.70 Output: 345W × 0.70 = 241W Conclusion: A 400Wp panel is producing 241W on a sunny harmattan day 40% below its rated output, with no cloud cover and no rain.
Temperature and irradiance are the two dominant loss factors. Four additional loss sources stack on top of them. Each one is smaller on its own. Combined, they push your real output down further and some of them are within your control to minimise.
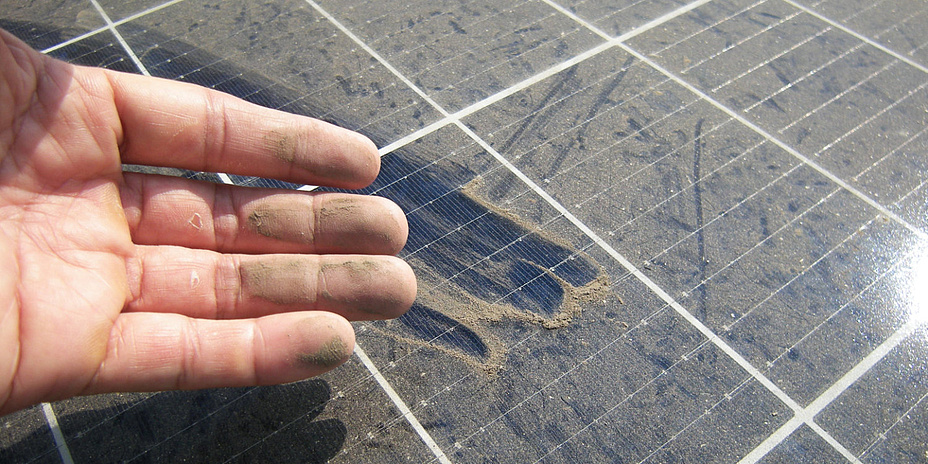
Dust and Soiling
Dust settles on panel surfaces continuously. A lightly soiled panel loses approximately 3–5% of output. A panel with two to three weeks of harmattan dust loses 15–25%. A panel that has not been cleaned in two months in a dusty environment can lose 30% or more.
This loss is separate from the atmospheric irradiance reduction caused by harmattan haze. That loss happens in the sky. This loss happens at the panel surface. Both occur simultaneously during harmattan. They compound.
Location / Condition
Soiling Loss
Derating Factor
Well-maintained, Lagos / PH
3–5%
0.95–0.97
Moderate dust, Abuja
7–12%
0.88–0.93
Heavy harmattan, northern Nigeria
15–25%
0.75–0.85
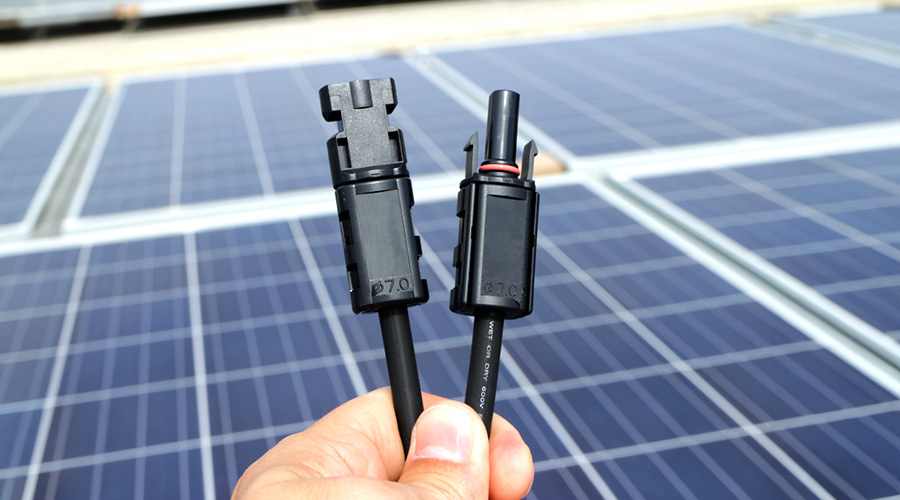
DC Wiring and Connector Losses
DC current flowing from your solar panels to your charge controller travels through cables and MC4 connectors. Every cable has electrical resistance. Current flowing through resistance generates heat and that heat is energy that was supposed to charge your battery.
A well-designed DC wiring system with correctly sized cables and clean MC4 connectors loses approximately 1–3% of panel output. A poorly designed system undersized cables, long runs, corroded connectors can lose 5–8% or more. This loss is entirely preventable. It is a design and installation quality issue, not a fundamental physics constraint.
Your MPPT charge controller converts panel output to the correct voltage for your battery bank. This conversion is not 100% efficient. A quality MPPT controller from a reputable brand operates at 94–97% efficiency. A budget controller operates at 88–93% sometimes lower at partial load.
No two solar panels are electrically identical. Manufacturing tolerances mean each panel has slightly different voltage and current characteristics. When panels are wired together in a string, the weakest panel limits the output of the entire string.
Mismatch loss is typically 1–3% for panels from the same batch. It becomes larger when panels from different batches, brands, or ages are mixed. For how series and parallel configurations affect mismatch, see Series vs Parallel vs Series-Parallel Solar Array Wiring.
Putting It All Together What a 400Wp Panel Actually Produces in Nigeria
You now have all the individual loss factors. This section combines them into complete derating calculations for three realistic Nigerian scenarios.
Scenario 1 Typical Case (Lagos, March, Quality Installation)
Loss Factor
Assumption
Derating Factor
Output Remaining
Rated output (STC)
Laboratory condition
—
400W
Temperature derating
Cell temp 63°C, Pmax -0.34%/°C
0.871
348W
Irradiance derating
850 W/m² actual vs 1,000 W/m² STC
0.850
296W
Dust and soiling
2 weeks since last clean, Lagos
0.950
281W
DC wiring losses
Correctly sized cables, short run
0.980
275W
MPPT losses
Quality controller, 96% efficient
0.960
264W
Panel mismatch
Same batch, same brand
0.980
259W
Real DC output to battery
0.647 combined
~259W
Scenario 2 Best Case (Lagos, December, Clean Panels)
Loss Factor
Assumption
Derating Factor
Output Remaining
Rated output (STC)
—
—
400W
Temperature derating
Cell temp 55°C, Pmax -0.34%/°C
0.898
359W
Irradiance derating
900 W/m² clear harmattan sky
0.900
323W
Dust and soiling
Recently cleaned
0.970
313W
DC wiring losses
Correctly sized
0.980
307W
MPPT losses
Quality controller
0.960
295W
Panel mismatch
Same batch
0.980
289W
Real DC output
0.722 combined
~289W
Scenario 3 Worst Case (Kano, January, Heavy Harmattan)
Loss Factor
Assumption
Derating Factor
Output Remaining
Rated output (STC)
—
—
400W
Temperature derating
Cell temp 62°C, Pmax -0.34%/°C
0.878
351W
Irradiance derating
680 W/m² heavy harmattan haze
0.680
239W
Dust and soiling
6 weeks without cleaning
0.780
186W
DC wiring losses
Undersized cables
0.940
175W
MPPT losses
Budget controller, 90% efficient
0.900
157W
Panel mismatch
Mixed batches
0.960
151W
Real DC output
0.378 combined
~151W
Summary Real Output Range for a 400Wp Panel in Nigeria
Scenario
Real Output
% of Rated
Best case (cool, clean, quality install)
280 – 320W
70 – 80%
Typical case (average conditions)
240 – 280W
60 – 70%
Worst case (harmattan, dirty, poor install)
150 – 200W
37 – 50%
The number to use for system sizing For Nigerian system planning: use 65–70% of rated output as your typical-day figure. For conservative design which is the correct engineering approach use 60–65%. A 400Wp panel contributes 240–260W to your sizing calculation. Not 400W.
Knowing that your 400Wp panel produces 260W on a typical day is useful on its own. But the real importance of this gap is what it does to your system when nobody accounts for it.
Most solar system failures in Nigeria are not hardware failures. The panels are not broken. The inverter is not faulty. The battery is not defective. The system was designed around a number that does not exist in the real world and it has been underperforming quietly ever since.
Battery Undercharging The Silent System Killer
When a designer sizes a system using STC output 400W per panel they calculate that each panel will contribute 400W × peak sun hours of energy per day. For Lagos at 4.5 peak sun hours, that is 400 × 4.5 = 1,800 Wh per panel per day.
The real figure, using a 65% derating factor, is 260W × 4.5 = 1,170 Wh per panel per day. That is a 630 Wh shortfall per panel per day. For a 6-panel array, the daily shortfall is 3,780 Wh nearly 3.8 kWh of energy the designer assumed was coming in but never arrives.
The battery absorbs this shortfall silently. Instead of charging to 95–100% state of charge every afternoon, it reaches 70–80%. Day after day, the battery cycles at a lower average state of charge than it was designed for. Repeated cycling at low states of charge accelerates cell imbalance and shortens battery lifespan.
“My Solar Is Not Enough” The Most Common Complaint in Nigeria
Walk into any solar forum or WhatsApp group focused on Nigerian solar. The single most common complaint is some version of: “my solar is not enough.”
In most of these cases, the system is not faulty. It is undersized and the undersizing happened at the design stage when the installer used STC wattage instead of derated real-world output.
Real example Abuja 3-bedroom flat Daily load: 8,000 Wh | Location: Abuja | Peak sun hours: 5.5 Using STC rating (wrong): 8,000 ÷ (400W × 5.5 hrs) = 8,000 ÷ 2,200 = 3.6 → 4 panels specified Using 65% derating (correct): 8,000 ÷ (260W × 5.5 hrs) = 8,000 ÷ 1,430 = 5.6 → 6 panels required The customer received 4 panels. They needed 6. The 2-panel shortfall caused entirely by ignoring derating is why the system never worked properly.
Question 1: What derating factor are you applying to panel output? A competent installer will give you a number typically 0.70 to 0.80 for Nigerian conditions.
Question 2: Are your calculations based on STC wattage or derated real-world output? The answer should be derated real-world output.
Question 3: What peak sun hours figure are you using for my location? They should give a specific number for your city Lagos 4.5, Abuja 5.5, Kano 6.0, Port Harcourt 4.0.
How to Design a System That Accounts for Real Output
Understanding why your panel underperforms is one thing. Designing around it is another. This section gives you the practical framework.
Always Size From Derated Output Not the Label
For Nigerian conditions, use a combined derating factor of 0.70 as your starting point for residential and commercial system design.
Port Harcourt example STC vs derated sizing Daily load: 6,500 Wh | Location: Port Harcourt | Peak sun hours: 4.0 Using STC rating (wrong): 6,500 ÷ (400W × 4.0) = 6,500 ÷ 1,600 = 4.1 → 4 panels specified Using 0.70 derating (correct): 6,500 ÷ (280W × 4.0) = 6,500 ÷ 1,120 = 5.8 → 6 panels required Two additional panels. In Port Harcourt lowest peak sun hours of any major Nigerian city and a long rainy season that difference determines whether the system works.
Design for the Worst Month Not the Average
A solar system that performs adequately in the average month will fail in the worst month. The engineering principle is straightforward: size for the constraint, not the average.
For Port Harcourt, use July peak sun hours of approximately 3.5 hours rather than the annual average of 4.0. For Kano, size for January harmattan conditions. The system that survives the worst month performs well in all other months.
Port Harcourt constraint month sizing (July, 3.5 peak sun hours):
One additional panel compared to the annual average calculation. That one panel keeps the battery charging adequately in July when every underpowered system in the area is struggling.
One practical rule to remember Multiply your panel’s rated wattage by 0.70 before using it in any sizing calculation. 400Wp panel → contributes 280W to your system design 550Wp panel → contributes 385W 300Wp panel → contributes 210W This single adjustment will produce a more accurate system specification than most solar quotations currently being issued in Nigeria.
400W Is a Rating, Not a Promise
Let us bring everything together.
Your solar panel is rated at 400W. That rating was measured in a laboratory under three conditions 1,000 W/m² irradiance, 25°C cell temperature, and a standardised solar spectrum. None of those three conditions exist on a Nigerian rooftop during normal operation.
In the real world, your panel faces Nigerian heat that pushes cell temperatures to 60–70°C. It faces irradiance that rarely reaches the STC reference level. It faces harmattan dust, humidity, wiring resistance, MPPT conversion losses, and manufacturing tolerances. Each of these factors takes a percentage off the rated output. Together, they reduce a 400Wp panel to approximately 240–290W on a typical Nigerian day.
That is not a defect. It is not a fraud. It is physics applied to a tropical climate that the STC rating was never designed to represent.
If you are buying a new system: insist that your installer sizes your panel array from derated output, not STC wattage. Ask them what derating factor they are applying. If they cannot answer, find someone who can.
If you already have a system that is underperforming: run the derating calculation for your specific location and conditions. Compare the derated output of your existing panels against your daily load. If the numbers do not balance, you have an undersized array.
If you are evaluating a quotation: apply the 0.70 derating factor to every panel in the proposal. If the derated output does not cover your load with margin for the worst month, the quotation is inadequate regardless of how many kilowatts are listed on the cover page.
The Nigerian solar market is full of systems that looked right on paper and failed in practice. The paper was right. The paper used STC numbers. The practice used Nigerian weather.
You now understand the gap. Use it.
Frequently Asked Questions
1. Why does my 400W solar panel output in Nigeria show only 250–280W on my charge controller?
This is normal. The 400W rating is measured under Standard Test Conditions a laboratory setting with 1,000 W/m² irradiance and 25°C cell temperature. Neither condition exists on a Nigerian rooftop. Temperature derating alone reduces output by 12–18% in Nigerian heat. Add irradiance reduction, dust losses, and system losses, and 250–280W is a realistic figure for a typical afternoon.
2. Is my panel faulty if it is producing less than its rated wattage?
Almost certainly not. A panel producing 65–75% of its rated output under normal Nigerian conditions is performing correctly. A panel would be considered faulty only if its output is significantly below what the derating calculations predict for example, producing 150W on a clear cool morning when it should be producing 320W or more.
3. What is the temperature coefficient and why does it matter?
The temperature coefficient of power (Pmax) tells you how much output your panel loses per degree Celsius above 25°C. A monocrystalline PERC panel with a coefficient of -0.34%/°C loses 0.34% of its rated output for every degree above 25°C. At 65°C cell temperature which is typical for Nigeria in the hot season that is a 13.6% output reduction. It is the most important performance number on a panel datasheet after efficiency.
4. What is the realistic output range for a 400Wp panel in Nigeria?
Under typical Nigerian conditions, a 400Wp monocrystalline PERC panel produces approximately 240–290W at the MPPT controller input. Best case cool month, clean panels, quality equipment you might see 300–320W. Worst case heavy harmattan dust, undersized cables, budget controller output can fall below 200W. For system sizing purposes, use 65–70% of rated output as your planning figure.
5. How does harmattan affect solar panel output?
Harmattan reduces panel output through two separate mechanisms. First, dust particles in the atmosphere scatter and absorb sunlight, reducing the irradiance reaching the panel surface sometimes by 25–40% compared to a clear day. Second, dust settles on the panel surface and blocks light from reaching the cells. Both losses occur simultaneously during harmattan. A panel not cleaned regularly during harmattan can lose 30–40% of output from these two effects combined before temperature derating is even applied.
6. What derating factor should I use when sizing a solar system in Nigeria?
Use a combined derating factor of 0.70 for standard residential and commercial system planning in Nigeria. A 400Wp panel contributes 280W to your system design. A 550Wp panel contributes 385W. For precision sizing that applies individual derating factors for your location and equipment, use the Eneronix Off-Grid Solar Sizing Calculator.
7. My installer sized my system using the full panel wattage. What should I do?
First, calculate what your system should actually be producing using the 0.70 derating factor and your location’s peak sun hours. Compare that figure against your daily load. If the gap is significant more than 20% your array is likely undersized. Adding correctly sized panels is the most direct solution. Before doing so, confirm your actual daily consumption using the Off-Grid System Load Audit Guide.
8. Does panel brand affect how much output is lost to heat?
Yes the temperature coefficient varies between panel types and quality tiers. A tier-1 monocrystalline PERC panel with a coefficient of -0.34%/°C loses less output to heat than a standard polycrystalline panel with -0.43%/°C. At 65°C cell temperature, that difference is approximately 14W per 400Wp panel. Budget or unbranded panels often have worse temperature coefficients sometimes -0.45%/°C or worse and higher NOCT values, meaning they run hotter under the same conditions.
9. Will adding more panels fix an underperforming system?
Adding panels fixes an undersized array but only if the rest of the system is sized to handle the additional input. Your MPPT charge controller must have sufficient capacity for the increased array current and power. Your battery bank must be large enough to store the additional energy. Adding panels without checking these limits can cause controller clipping or wasted energy. See the MPPT Charge Controller Selection Guide before expanding any array.
10. How do I calculate what my panel is actually producing right now?
You need your panel’s temperature coefficient (from the datasheet), your current ambient temperature, and the panel’s NOCT rating. Use the formula Tcell = Tambient + [(NOCT − 20) / 800] × Irradiance to estimate cell temperature. Then calculate power loss as (Tcell − 25) × |Pmax coefficient|. Apply that percentage reduction to the rated wattage, then multiply by the irradiance ratio (actual irradiance ÷ 1,000). For a faster approach, use the Eneronix Solar & MPPT Calculator.
I am Engr. Ubokobong Ekpenyong, a solar specialist and lithium battery systems engineer with over five years of hands-on experience designing, assembling, and commissioning off-grid solar and energy storage systems. My work focuses on lithium battery pack architecture, BMS configuration, and system reliability in off-grid and high-demand environments.
ID used to identify users for 24 hours after last activity
24 hours
_gat
Used to monitor number of Google Analytics server requests when using Google Tag Manager
1 minute
_gac_
Contains information related to marketing campaigns of the user. These are shared with Google AdWords / Google Ads when the Google Ads and Google Analytics accounts are linked together.
90 days
__utma
ID used to identify users and sessions
2 years after last activity
__utmt
Used to monitor number of Google Analytics server requests
10 minutes
__utmb
Used to distinguish new sessions and visits. This cookie is set when the GA.js javascript library is loaded and there is no existing __utmb cookie. The cookie is updated every time data is sent to the Google Analytics server.
30 minutes after last activity
__utmc
Used only with old Urchin versions of Google Analytics and not with GA.js. Was used to distinguish between new sessions and visits at the end of a session.
End of session (browser)
__utmz
Contains information about the traffic source or campaign that directed user to the website. The cookie is set when the GA.js javascript is loaded and updated when data is sent to the Google Anaytics server
6 months after last activity
__utmv
Contains custom information set by the web developer via the _setCustomVar method in Google Analytics. This cookie is updated every time new data is sent to the Google Analytics server.
2 years after last activity
__utmx
Used to determine whether a user is included in an A / B or Multivariate test.
18 months
_ga
ID used to identify users
2 years
_gali
Used by Google Analytics to determine which links on a page are being clicked
30 seconds
_ga_
ID used to identify users
2 years
You can find more information in our Cookie Policy and .
.jpg)


: Prices, Types & How to Choose")

: Prices, Types & How to Choose")

")
")


