Introduction
Here is a failure pattern I encounter more often than I should. A client commissions an off-grid system, the battery bank is correctly sized, the solar array delivers as expected, and yet the inverter trips two or three times every morning before 8am. The installer comes back, checks the wiring, checks the BMS communication, finds nothing wrong, and leaves the client with a system that works fine by 9am but is unreliable during the exact hours the household needs it most.
If your off-grid inverter keeps tripping in the morning, the root cause is almost always the same: the inverter was sized to the average load instead of the peak load. The two numbers look related on paper but they serve completely different engineering purposes, and designing around one when you need the other produces exactly this kind of failure.
Average load and peak load are not two ways of describing the same thing. They are two separate inputs that feed two separate sizing calculations. Knowing how to calculate peak load off-grid correctly, and how to use it alongside your average load figure, is what separates a system that performs reliably from one that disappoints its owners from the first week of operation.
In this post I am going to define both numbers precisely, show you the calculation methodology for each, and explain exactly where each one belongs in the design process.
Engineering Rule:
Battery sizing = energy calculation -> use average daily load (Wh)
Inverter sizing= power calculation -> use peak coincident load (W / kVA)
 Cable sizing= current calculation -> use maximum sustained peak current (A)
Defining the Two Numbers and Why Both Matter
Before we get into sizing methodology, I want to establish precise definitions for both terms because loose language around these two concepts is where most design errors begin.
Average load is the mean power demand of a system over a defined time period, typically 24 hours. It is calculated by dividing total daily energy consumption in watt-hours by the number of hours in the period. If your load audit produces a total daily energy demand of 6,000Wh, your average load over 24 hours is 250W. That number is real and useful, but only for one specific purpose: understanding the steady-state energy throughput the battery and solar array must support over time.
Peak load is the maximum instantaneous or short-duration power demand the system experiences at any point during normal operation. It is not an average. It is not a typical condition. It is the worst-case coincident power draw the system must handle without tripping, disconnecting, or thermally overloading any component. On a residential off-grid system, peak load almost always occurs during the morning startup window when multiple high-draw appliances come on within a short period of each other.
The reason both numbers matter is that they feed completely different sizing calculations. Average load feeds battery and solar array sizing because these components are concerned with energy over time, how many watt-hours must be stored and replenished across a day. Peak load feeds inverter sizing, cable sizing, and protection device sizing because these components are concerned with instantaneous power delivery capacity.
What makes this dangerous in practice is that the two numbers can differ by an order of magnitude on the same installation. A system with a 250W average load and a 3,500W morning peak looks balanced on an energy audit but will destroy an inverter sized to the average. Conversely, a system where the designer sized the battery to the peak load instead of the daily energy demand will have a battery bank three to four times larger than necessary, at significant unnecessary cost. Getting both numbers right, and using each one correctly, is the foundation of a properly engineered off-grid system.
How Average Load Drives Battery Sizing
The average load figure is the correct input for battery sizing, but I want to be precise about what that means in practice because there is a subtlety here that trips up even experienced designers.
You do not size your battery bank to the average load directly. You size it to the total daily energy demand the load audit produces, which is the sum of all individual load contributions in watt-hours per day. The average load is simply that daily energy figure divided by 24 hours. Battery sizing is fundamentally an energy calculation, not a power calculation. You are answering the question of how many watt-hours the battery must store and deliver across a full day and across your chosen days of autonomy, not how many watts it must deliver at any given moment.
The formal relationship is:
Battery Capacity (Wh) = E_daily x Days of Autonomy / DoD
Where:
E_daily = corrected daily energy demand from the load audit (Wh)
Days of Autonomy = consecutive days the battery must operate without solar input
DoD = maximum depth of discharge as a decimal (0.80 for LiFePO4)
What happens when designers mistakenly use peak load for battery sizing is instructive. Consider a system with a 3,500W morning peak and a 6,000Wh daily energy demand. The table below shows the consequence of using the wrong input:
| Scenario | Input Used | Calculation | Result | Verdict |
| Wrong approach | Peak load (3,500W) | 3,500 x 24h / 0.80 | 105,000Wh (105kWh) | 7x oversized |
| Correct approach | Daily energy (6,000Wh) | 6,000 x 2 days / 0.80 | 15,000Wh (15kWh) | Correctly sized |
That seven-fold difference is driven entirely by using the wrong input number. The battery does not need to sustain peak load continuously. It needs to sustain average energy throughput over time while the inverter handles the instantaneous peak delivery. These are separate responsibilities handled by separate components, and keeping them separate in your calculations is what produces a correctly proportioned system.
For the complete load audit methodology that produces the E_daily figure used in this calculation, see our full engineering walkthrough on off-grid load audit methodology and battery sizing.
How Peak Load Drives Inverter Sizing
If average load is the input for battery sizing, peak load is the input for inverter sizing, and the distinction between momentary and sustained peak load is what determines exactly which inverter specification you need to match.
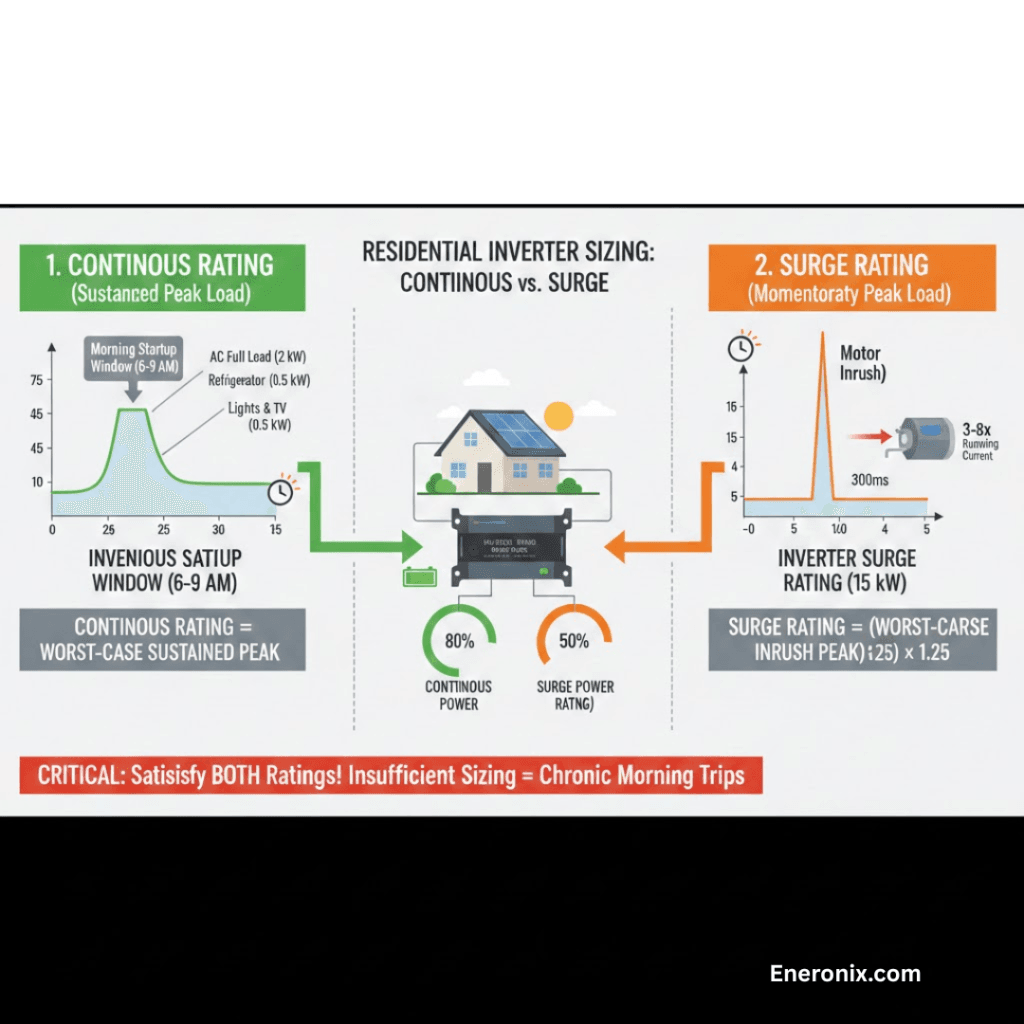
Every quality inverter has two power ratings. The continuous rating is the maximum power the inverter can deliver indefinitely without thermal shutdown. The surge or peak rating is the maximum power the inverter can deliver for a short duration, typically between 5 and 30 seconds depending on the manufacturer, to handle motor startup inrush. When sizing an inverter you need to satisfy both ratings simultaneously, and they answer two different questions about your load profile.
The continuous rating must exceed your worst-case sustained peak load. This is the highest power level the system will need to maintain for extended periods, not milliseconds, not seconds, but minutes to hours. In practice this means identifying the highest combination of loads that could run simultaneously for a sustained period. On a typical residential system this might be the air conditioner running at full load while the refrigerator compressor is active, the lighting circuit is on, and a television is running.
The surge rating must exceed your worst-case momentary peak, which is driven almost entirely by motor inrush current. Inrush current on direct-on-line motor starts reaches 3 to 8 times the running current for 100 to 500 milliseconds. The inverter surge rating must comfortably cover the largest single motor startup that could occur while other loads are already running. I use a minimum surge margin of 25 percent above the calculated worst-case inrush peak when selecting an inverter, not exactly at the limit.
The morning startup window is where both constraints become active simultaneously. Sustained loads are coming online while motor inrush events are occurring, which means the inverter is being tested on both its continuous and surge ratings within the same short window. Sizing to either constraint alone is what produces the chronic morning trip pattern described in the introduction.
Engineering Rule:
Continuous rating -> must exceed worst-case sustained coincident load (W)
Surge rating -> must exceed worst-case motor inrush peak (W)
Surge margin -> minimum 25% above calculated worst-case inrush
For a deeper understanding of how inrush current interacts with BMS overcurrent protection during peak demand events, see our engineering breakdown on BMS-inverter overcurrent protection and communication failures and our system-level analysis of why most solar battery systems fail before year 2.
Inductive Motor Loads and Power Factor at Startup
There is a dimension to peak load that watt figures alone do not capture, and ignoring it leads to inverter selections that look correct on paper but underperform in the field. That dimension is power factor, specifically what happens to power factor during inductive motor startup, and why it forces you to think in apparent power rather than real power when sizing an inverter for motor-heavy systems.
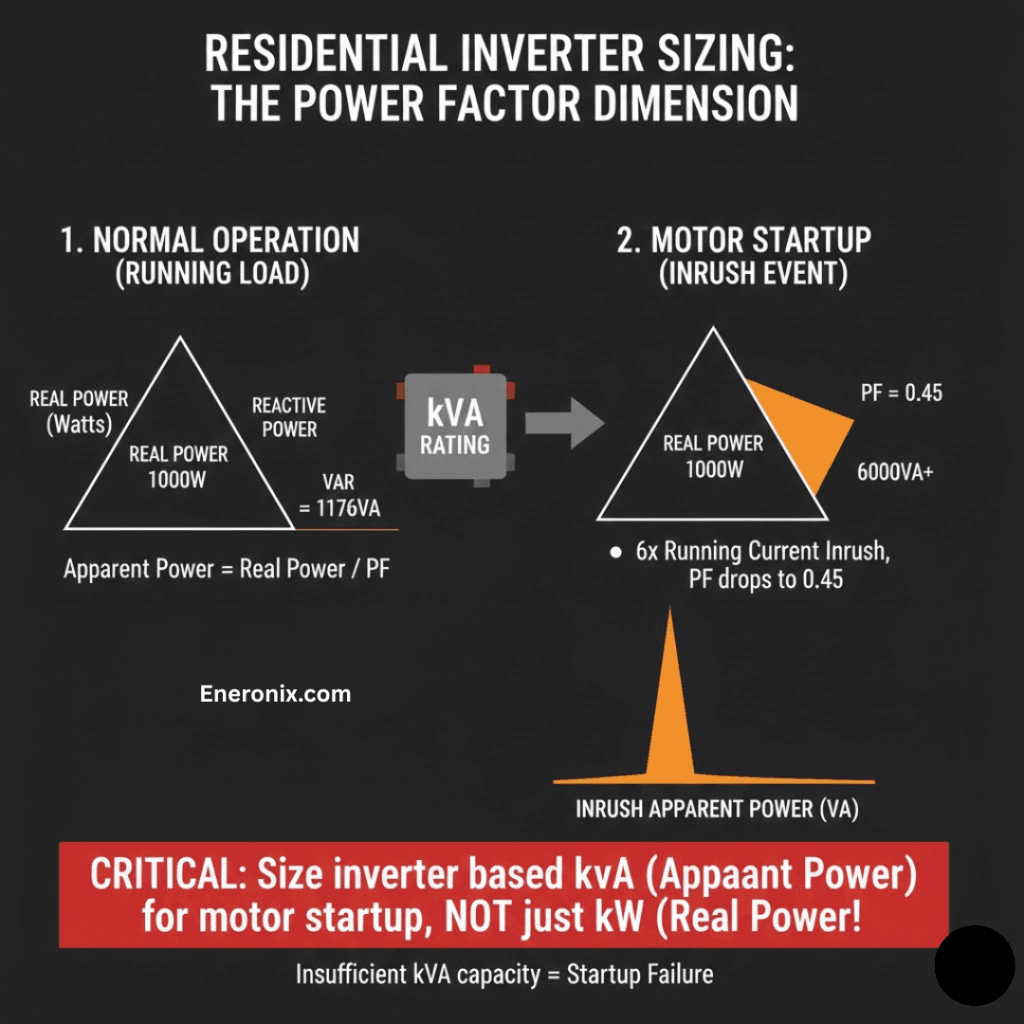
Real power, measured in watts, is the actual work being done by the load. Reactive power, measured in volt-amperes reactive, is the power that inductive loads draw from the source to establish and maintain their magnetic fields but do not convert to useful work. Apparent power, measured in volt-amperes or kVA, is the vector sum of both and represents the total electrical burden the inverter must supply. Power factor is the ratio of real power to apparent power.
Under normal running conditions, a well-designed induction motor operates at a power factor of 0.8 to 0.9. During startup however, power factor drops sharply, often falling to 0.4 to 0.5 or below for the duration of the inrush event. What this means in practice is that the apparent power demand during startup is significantly higher than the watt figure suggests.
Here is a concrete example. A 1,000W running load motor with a power factor of 0.85 during normal operation draws approximately 1,176VA from the inverter. During startup, with an inrush of 6 times running current and a power factor of 0.45, the apparent power demand spikes to well above 6,000VA momentarily. An inverter rated at 3,000W continuous but only 3,000VA apparent power cannot service this startup event correctly, even though the running load is well within its capacity.
This is why inverter specifications use kVA ratings as their primary capacity figure. A 5kVA inverter at 0.8 power factor has a real power output of 4kW. When your loads present a lower power factor during startup, you are effectively reducing the real power the inverter can deliver at that moment. Always check the kVA rating against your calculated worst-case apparent power demand during motor startup, not just the watt figure.
Engineering Rule:
Motor PF at run -> 0.80 to 0.90
Motor PF at startup -> 0.40 to 0.50 (or lower)
Size inverter in kVA, not kW, for motor-heavy systems
For additional context on how inverter voltage and topology affect power delivery under reactive load conditions, see our practitioner guide on high voltage vs low voltage inverter selection for off-grid systems.
LiFePO4 Battery C-Rate and Peak Load Interaction
Peak load does not only stress the inverter. It places an equally important demand on the battery bank, and understanding how LiFePO4 discharge ratings interact with peak load events is critical to avoiding BMS disconnects and premature capacity degradation.
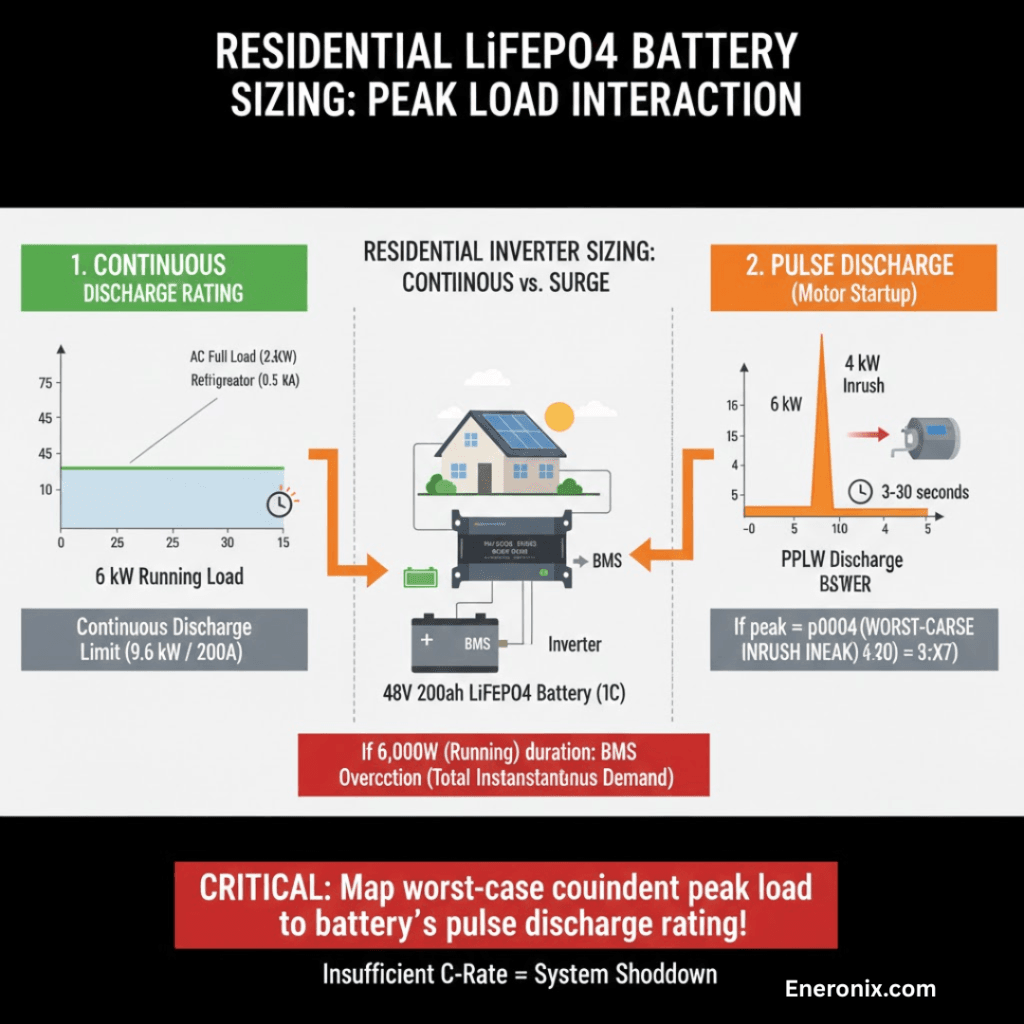
Every LiFePO4 battery has two discharge current specifications that matter here. The continuous discharge rating is the maximum current the battery can deliver indefinitely without triggering thermal protection or accelerating capacity loss. The pulse discharge rating is the maximum current the battery can deliver for a short duration, typically between 3 and 30 seconds depending on the manufacturer, before the BMS steps in to protect the cells. These two figures define the operating envelope within which your peak load events must fall.
The interaction becomes critical when a large motor load starts during a period when other loads are already drawing significant current from the battery. Consider a 48V system with a 200Ah LiFePO4 battery rated at 1C continuous discharge, giving a maximum continuous current of 200A or 9,600W. If the system is already delivering 6,000W to running loads when a borehole pump starts and pulls an inrush of 4,000W, the total instantaneous demand jumps to 10,000W, exceeding the continuous rating. If this peak lasts longer than the pulse discharge window the BMS allows, the BMS overcurrent protection will disconnect the battery entirely, dropping all loads simultaneously.
What I always do before finalizing inverter and load configuration on any LiFePO4 system is pull the battery manufacturer’s datasheet and confirm both the continuous and pulse discharge current ratings, along with the maximum pulse duration. I then map the worst-case coincident peak load against those ratings to confirm the system stays within the pulse window. If it does not, the solution is either to increase battery bank capacity, add a second parallel battery string to distribute the current demand, or implement soft starters on the largest motor loads.
Engineering Rule:
Confirm continuous discharge current rating before finalizing inverter size
Confirm pulse discharge rating and maximum pulse duration from datasheet
Map worst-case coincident peak against both ratings before commissioning
For a deeper understanding of how BMS protection thresholds interact with discharge events, see our technical breakdown of passive balancing BMS failure modes in high-discharge solar battery systems and our engineering guide on CVL, CCL, and DCL dynamic battery limits in real-time systems.
Cable and Fuse Sizing for Peak vs. Average Load
The peak versus average load distinction does not stop at the inverter and battery. It extends directly into cable sizing and protection device selection, and getting it wrong at this level creates failure modes that are slower to appear but equally damaging when they do.

Cable sizing is a thermal problem at its core. A conductor carrying current generates heat proportional to the square of that current multiplied by the conductor resistance. When you size a cable to the average load current rather than the peak load current, you are selecting a conductor that can handle the thermal steady state of normal operation but will overheat progressively during sustained peak demand periods. The insulation degrades, resistance increases over time, and eventually you have a cable that runs hot under conditions that should be routine. On DC systems operating at 48V, where currents are high relative to the power being delivered, this problem is more acute than on higher voltage AC systems.
The correct approach is to size the cable to the maximum sustained peak current the circuit will carry, not the average. I use the worst-case sustained peak demand figure from the load profile, convert it to current at the system voltage, apply the appropriate derating factors for ambient temperature and cable bundling, and select the conductor size from there. The average load current then becomes a verification check confirming the selected cable is not dramatically oversized.
Fuse and circuit breaker sizing follows a parallel logic but with an additional nuance. Protection devices must be sized to protect the cable, not the load. This means the fuse rating must be above the peak operating current to avoid nuisance tripping during legitimate motor startups, but below the cable’s maximum current carrying capacity to provide genuine fault protection. A fuse sized too close to the average load current will trip every time a large motor starts. A fuse sized above the cable’s thermal limit provides no real protection at all.
The practical rule I follow is to select a fuse rating at 125 to 150 percent of the maximum sustained peak current, confirm that this rating is below the cable ampacity, and verify that the fuse will clear a bolted fault at the end of the cable run within the time required by the applicable installation standard.
Engineering Rule:
Size cables to maximum sustained peak current, not average load current
Fuse rating = 125 to 150% of maximum sustained peak current
Fuse rating must remain below cable ampacity to provide real protection
For a detailed treatment of cable gauge selection and voltage drop in solar DC systems, see our engineering post on solar system cable gauge, length, and performance impact and our field analysis of why voltage drop is more critical in 12V and 24V solar systems.
Demand Factor: Calculating Real-World Peak Load Off-Grid
Demand factor is a concept that sits close to diversity factor in electrical engineering theory but serves a different practical purpose in off-grid system design. Where diversity factor describes the probability that loads will coincide at their individual peaks, demand factor describes the ratio of the actual maximum demand the system reaches to the total connected load capacity. Understanding this distinction is what separates a realistic peak load estimate from one that is either dangerously optimistic or unnecessarily inflated.
The formal equation is:
Demand Factor (DF) = Maximum Demand / Total Connected Load
Where:
Maximum Demand = highest sustained power draw the system actually reaches (W)
Total Connected Load = sum of all individual load ratings connected to the system (W)
DF= demand factor (expressed as a decimal between 0 and 1.0)
On residential off-grid systems I consistently measure demand factors in the range of 0.4 to 0.6. This means the actual peak demand the system reaches is between 40 and 60 percent of the total connected load. A home with 8,000W of connected appliances rarely if ever draws all 8,000W simultaneously. The realistic peak under normal morning conditions is more likely to sit between 3,200W and 4,800W.
The critical point here is that demand factor must be calculated from observation or careful load profile analysis, not assumed from a textbook figure. The 0.4 to 0.6 range is a starting reference, not a design input. Every installation has a different load mix, different occupant behavior, and different daily routines that shift where and when the peak demand occurs. I always build a time-of-day load profile for every system I design, mapping each load against its likely operating window across a typical day, and I identify the highest coincident demand window from that profile rather than applying a blanket factor.
What this exercise consistently reveals is that the worst-case peak is almost always concentrated in a 30 to 90 minute window in the morning and a secondary peak in the early evening. Knowing exactly when the peak occurs and what loads contribute to it allows you to make targeted decisions rather than simply oversizing the inverter to absorb whatever the worst case might be.
Soft Starters, VSDs, and Inverter-Driven Compressors
One of the most cost-effective interventions available in off-grid system design is rarely discussed in load audit guides: specifying motor control equipment that reduces inrush current at startup. Soft starters, variable speed drives, and inverter-driven compressors do not just protect motors from mechanical stress. They fundamentally change the peak load profile of the system in ways that can allow a smaller, more efficient inverter to be selected without compromising system capability.
A direct-on-line motor start is the worst-case inrush scenario. The motor is connected directly to the supply voltage with no current limiting, and the full inrush event, 3 to 8 times running current, hits the inverter and battery simultaneously. A soft starter addresses this by ramping the voltage up to the motor gradually over a controlled time period, typically 2 to 10 seconds, which spreads the inrush energy over time and reduces the peak current demand significantly. In practice, a well-configured soft starter can reduce inrush current from 6 times running current to 2 to 3 times running current, which has a direct and proportional effect on the inverter surge rating required.
Variable speed drives go further. By controlling motor speed electronically and starting the motor at low frequency before ramping up, a VSD can reduce startup current to barely above the running current level. For a borehole pump application where the pump is starting against a full static head, this is a significant engineering advantage. The inverter surge requirement effectively disappears as a design constraint when VSDs are specified on all major motor loads.
Inverter-driven compressors in modern air conditioners and refrigerators achieve a similar result through their built-in control electronics. This is worth documenting explicitly in the load audit because it changes the inrush assumption for that load from 3 to 8 times running current to approximately 1.2 to 1.5 times running current. On a system with multiple air conditioning units, this single distinction can shift the inverter sizing calculation by several kilowatts and reduce system cost meaningfully.
Building Your Peak Load Profile
Everything covered in this post converges into one practical deliverable: a time-of-day peak load profile that maps your system’s power demand against the hours of a typical operating day. This profile is the tool that makes peak load tangible and actionable, turning it from an abstract worst-case number into a clear picture of exactly when the system is under maximum stress and what is causing it.
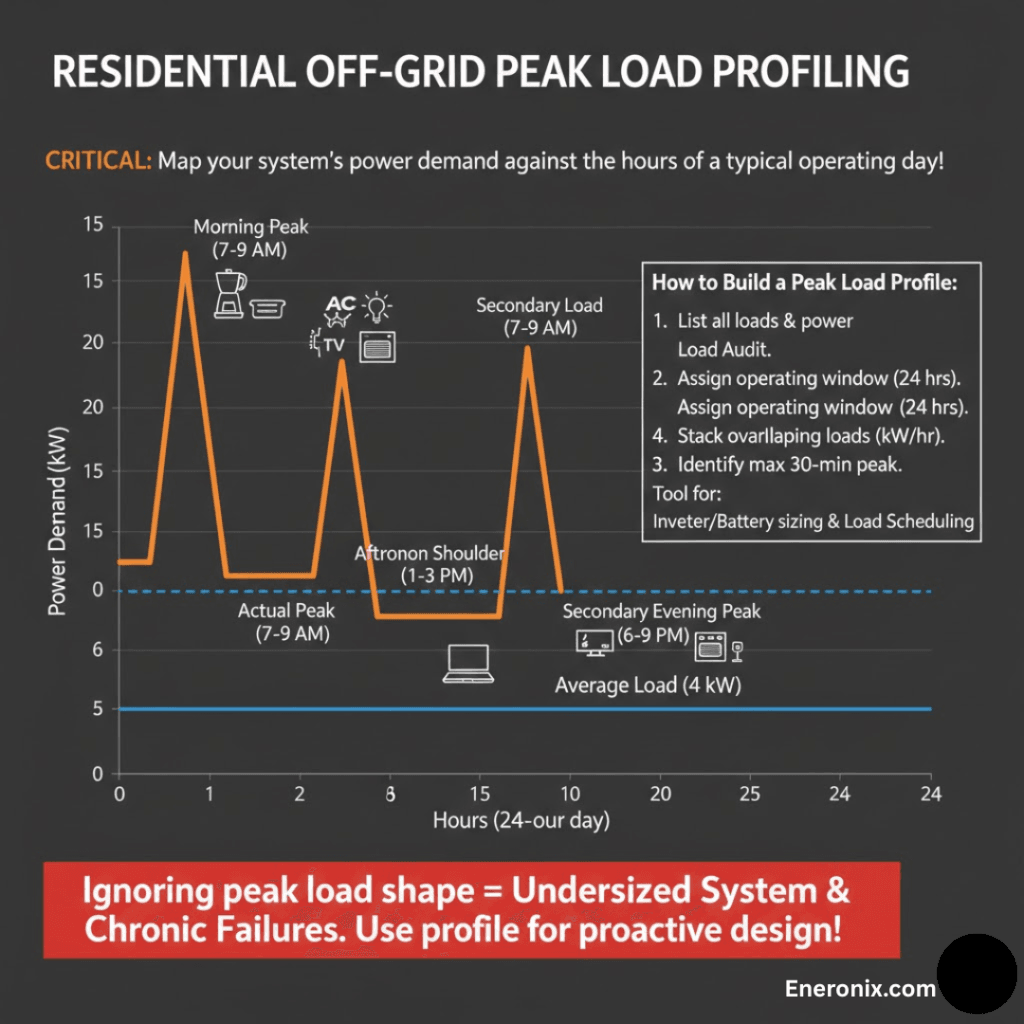
The way I build this profile is straightforward. I take every load from the audit table developed in our engineering guide on off-grid load audit methodology and battery sizing and assign it an operating window across the 24 hour day based on actual household or facility usage patterns. I then stack the loads that overlap within each hour and identify the hour with the highest total coincident demand. That hour, and specifically the worst 30 minute window within it, defines the peak load the inverter and protection system must handle.
What this exercise consistently reveals is a demand shape that bears no resemblance to the flat average load line. The morning peak climbs sharply as the household wakes up, drops off mid-morning as deferrable loads finish, runs at moderate levels through the afternoon, and produces a secondary evening peak as lighting, entertainment, and cooking loads overlap. The average load line cuts straight through the middle of this curve, representing none of the actual stress points the system experiences.
The peak load profile also serves as the basis for load scheduling decisions. Once you can see which loads are driving the morning peak, you can make deliberate choices about which ones to defer, which ones to put on timers, and which ones justify the investment in soft starters or variable speed drives. This turns peak load management from a reactive troubleshooting exercise into a proactive design decision made before a single component is purchased.
Conclusion
The core message of this post is simple but its implications run through every component selection decision in an off-grid system design. Average load and peak load are not two descriptions of the same thing. They are two separate engineering inputs that answer two separate questions, and each one belongs in a specific place in the sizing methodology.
Average load, derived from your total daily energy demand, belongs in the battery sizing calculation. It tells you how much energy the system must store and cycle through on a daily basis, how large the battery bank needs to be to sustain the load through nights and cloudy periods, and how much solar harvest is needed to replenish what is consumed. It is an energy question answered in watt-hours.
Peak load, derived from your worst-case coincident demand profile, belongs in the inverter sizing calculation, the cable sizing calculation, and the protection device selection process. It tells you how much instantaneous power the system must be capable of delivering at a single worst-case moment, how large the inverter surge capacity needs to be, and how robust the conductors and fuses must be to handle that moment without overheating or tripping. It is a power question answered in watts and kVA.
A system designed with both numbers correctly calculated and correctly applied will have a battery bank sized to its actual energy needs, an inverter sized to its actual power demands, and cables and protection devices that handle both steady-state and peak conditions without compromise.
Engineering Rule:
Average load (Wh)-> battery capacity, solar array size
Peak load (W/kVA)-> inverter continuous and surge rating
Peak current (A)-> cable ampacity, fuse and breaker selection
These are parallel calculations — run both before specifying any component
In the next post in this series we tackle phantom loads and standby power in detail, examining exactly how background energy consumption quietly erodes system autonomy and what to do about it. You can also revisit the foundation of this series in our engineering guide on how to do a proper load audit before sizing an off-grid system.

Hi, i am Engr. Ubokobong a solar specialist and lithium battery systems engineer, with over five years of practical experience designing, assembling, and analyzing lithium battery packs for solar and energy storage applications, and installation. His interests center on cell architecture, BMS behavior, system reliability, of lithium batteries in off-grid and high-demand environments.