Introduction
Here is the first thing I want you to understand: most off-grid systems fail at the design stage, not the installation stage. And the failure almost always traces back to one thing, a load audit that was either skipped entirely or done with nameplate ratings pulled off appliance stickers.
I have walked into installations where a homeowner spent good money on a 10kWh lithium battery bank and a 5kVA inverter, only to find the system shutting down every evening by 9pm. The battery was not faulty. The inverter was not undersized. The problem was that nobody had actually measured what the loads were drawing in real operation. The system was designed around numbers that looked right on paper but had no relationship to what was happening on the wire.
A proper off-grid load audit is the foundation every other sizing decision is built on. Get it wrong and it does not matter how good your BMS is, how well your MPPT is configured, or how carefully you sized your solar array. You are building on a cracked slab.
In this guide, I am going to walk you through how to conduct an off-grid load audit the right way, the way that produces a number you can actually design a system around with confidence.
Why Nameplate Ratings Will Lie to You
The first mistake I see on almost every DIY and even some professional off-grid designs is treating the nameplate rating on an appliance as the actual load. It is not. It is a worst-case ceiling figure, and in most cases, the appliance never gets close to it during normal operation.
Manufacturers print rated wattage based on maximum possible draw under specific test conditions. A ceiling fan rated at 75W may pull 55W at the speed setting the owner actually uses. A television rated at 150W may draw 90W during normal viewing. A washing machine rated at 2,000W may only hit that number during the heating cycle, which on a cold wash setting never activates. If you sum up nameplate ratings across an entire household and design your battery bank around that number, you will build a system that is significantly oversized, which means money wasted on battery capacity that never gets used.
The opposite error is just as dangerous. Some installers apply a blanket derating factor, say 70% of nameplate, across all appliances without distinguishing between load types. This works reasonably well for resistive loads but falls apart entirely for motor loads, where actual draw varies with mechanical load, aging, and ambient temperature.
In practice, the only number worth designing around is a measured number. I use a clamp meter on the live conductor feeding the appliance under real operating conditions, not startup, not idle, but during normal sustained operation. For whole-circuit measurements, a plug-in energy monitor like a Shelly EM or a Victron Energy Meter gives you real-time watts, power factor, and cumulative kWh over time, which is far more useful than a single instantaneous reading.
What I look for specifically is the steady-state running wattage after any startup transient has settled, typically 3 to 5 seconds after the load comes on. That is the number I enter into the load audit table. Nameplate goes in a separate column for reference, but it never drives the design calculation. This single discipline, measuring instead of assuming, will produce a more accurate off-grid load audit than any shortcut method I have seen.
Understanding Load Types: Resistive vs. Motor Loads

Once you have committed to measuring your loads rather than reading nameplates, the next thing you need to understand is that not all loads behave the same way on the wire. The distinction that matters most in off-grid system design is the difference between resistive loads and motor loads, and getting this wrong is what causes inverter trips, nuisance shutdowns, and premature inverter failure.
Resistive loads are the simplest loads in any system. Electric heaters, incandescent bulbs, toasters, and kettles all fall into this category. What makes them straightforward is that their current draw is linear and predictable. When you switch on a 1,000W kettle, it draws close to 1,000W from the moment it turns on until it turns off. There is no startup surge, no variation with mechanical load, and no power factor correction required. For sizing purposes, what you measure is what you get.
Motor loads are an entirely different problem. Refrigerators, water pumps, air conditioners, washing machine motors, and power tools all use inductive motors that require significantly more current to start than they need to run. This startup surge, commonly called inrush current, can reach 3 to 8 times the rated running current and typically lasts between 100 and 500 milliseconds. It is brief, but it is violent from an electrical standpoint.
Also Read: Designing an Off-Grid Power System Using Lithium Batteries
Here is what that looks like in practice. A borehole pump with a 500W running load may pull 2,500 to 4,000W for the first quarter second every time it starts. If your inverter is sized at 1,000W continuous with a 2,000W peak rating, that pump will trip the inverter on every startup cycle, even though the running load is well within the inverter’s continuous capacity. I have seen this scenario repeatedly on sites where the installer sized the inverter to the running load and ignored the surge entirely.
The BMS adds another layer of complexity here. A well-configured LiFePO4 battery BMS has an overcurrent protection threshold, typically set at 1.2 to 1.5 times the rated discharge current. A large inrush event can momentarily exceed this threshold and trigger a BMS disconnect, which drops the entire system load instantly. On systems with multiple motor loads starting in sequence, this risk compounds quickly.
The practical rule I follow is to size the inverter surge rating to at least 3 times the largest single motor load on the system, and to stagger motor load startups during commissioning wherever the control system allows it.
Calculating Real Daily Energy Consumption
This is the section where the off-grid load audit either becomes a useful engineering document or stays a guess dressed up in a spreadsheet. The goal here is to arrive at a single number: total daily energy consumption in kilowatt-hours, calculated from real operating behavior, not rated values.
The method I use is the duty cycle approach. Instead of multiplying nameplate watts by hours of use, I multiply measured running watts by actual runtime, which is the fraction of time the appliance is genuinely drawing power within its operating window. These are two very different things, and confusing them is one of the most common sizing errors I encounter.
The formal expression for this is:
E_daily = P_measured x t_runtime
Where:

E_daily = daily energy consumption (Wh)

P_measured = measured running watts (W)

t_runtime = actual daily runtime in hours (h), accounting for duty cycle
The refrigerator is the best example to illustrate this. A typical household refrigerator compressor is rated at 150W running load. Most people assume it runs continuously and calculate 150W multiplied by 24 hours, arriving at 3.6 kWh per day. In reality, a properly functioning refrigerator compressor cycles on and off to maintain temperature.
Depending on ambient temperature, door opening frequency, and thermostat setting, the compressor runs approximately 30 to 40 percent of the time. That gives an actual daily runtime of 7.2 to 9.6 hours, and a real daily consumption of between 1.08 and 1.44 kWh per day, less than half the nameplate estimate. Getting this wrong on a system with two refrigerators means you have oversized your battery bank by more than 5 kWh before you have even looked at any other load.
The load audit table I build for every system captures this properly. Here is what that table looks like with real entries:
| Appliance | Measured W | Duty Cycle % | Daily Op. Hours | Daily Runtime (h) | Daily Energy (Wh) |
| Refrigerator | 150W | 35% | 24h | 8.4h | 1,260Wh |
| Water Pump | 400W | 100% | 3h | 3h | 1,200Wh |
| Ceiling Fan | 55W | 100% | 8h | 8h | 440Wh |
| LED Lighting | 120W | 100% | 5h | 5h | 600Wh |
| Inverter Standby | 20W | 100% | 24h | 24h | 480Wh |
| TOTAL | 3,980Wh |
Every load gets its own row. Every row feeds one column. That final column total is your baseline daily energy demand, and it is the only number that moves forward into battery sizing.
Categorizing Loads by Priority
Once you have your daily energy consumption figure, the next step that most load audits skip entirely is categorizing loads by priority. This is not an administrative exercise. It directly determines how you set your battery depth of discharge limits, how you size your inverter, and in some cases, whether you need a load shedding controller in the system architecture.
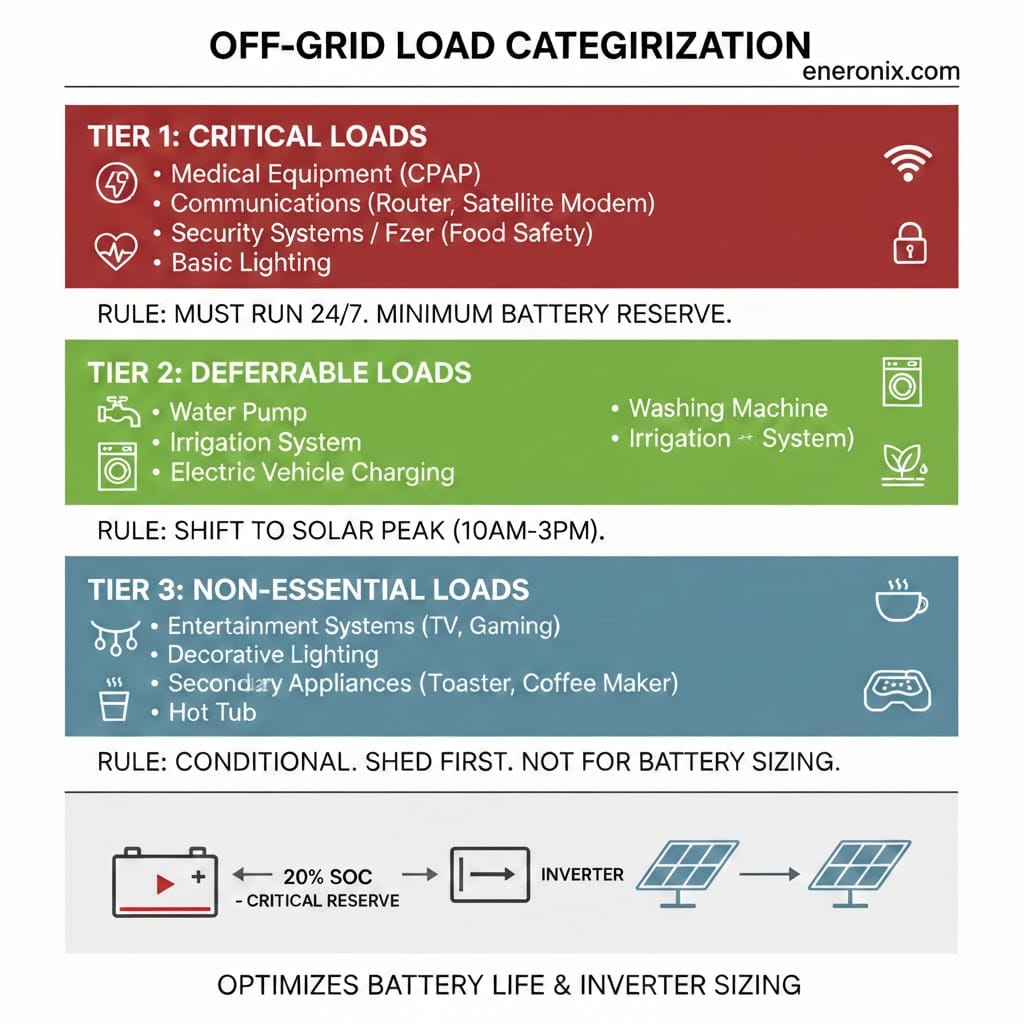
I divide every load into three tiers. Critical loads are the ones that must stay on regardless of battery state or solar availability. These include medical equipment, communications infrastructure, security systems, and basic lighting. In a residential off-grid system, the refrigerator often falls here too, not because of comfort but because of food safety. Critical loads define the minimum battery reserve the system must always protect. In practice, I set the BMS low voltage disconnect and the inverter low battery cutoff to ensure critical loads can run for at least one full night without any solar input, typically targeting a minimum state of charge of 20 percent on a LiFePO4 bank.
Deferrable loads are loads that need to run daily but can be shifted in time without consequence. Water pumps, washing machines, and irrigation systems fall into this category. These loads are ideally scheduled to run during peak solar production hours, between 10am and 3pm, so they draw directly from the array rather than from the battery. A proper load audit flags these loads separately so the system designer or the homeowner knows they can be timed to reduce battery stress.
Non-essential loads are everything else. Entertainment systems, decorative lighting, and secondary appliances that run occasionally. The critical rule I enforce here is this: you never size your battery bank to support non-essential loads through a cloudy day. Non-essential loads are the first to be shed when the system is under stress, and the battery sizing calculation should treat them as conditional, not guaranteed.
The reason this categorization matters beyond system design is inverter sizing. If your critical load cluster peaks at 1.5kW and your total load peak including non-essential items hits 4kW, you do not need a 4kW inverter rated for continuous critical duty. Understanding load tiers prevents significant oversizing at the inverter level and keeps your system cost honest.
Seasonal Load Variation The Audit Most Designers Skip
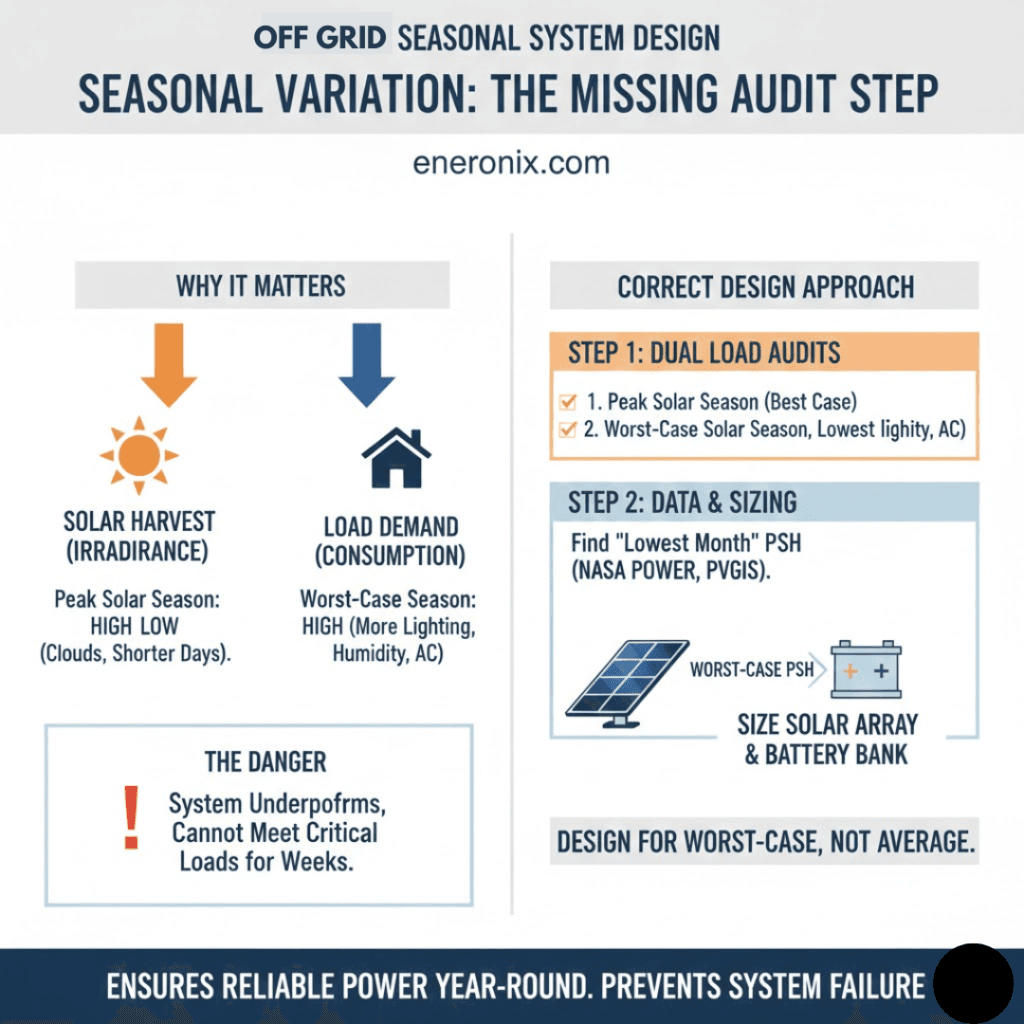
If there is one part of the off-grid load audit that gets skipped more consistently than any other, it is seasonal variation. I understand why it happens. When a client wants a system designed, they want it designed now, based on current conditions. But an off-grid system is not a snapshot device. It has to perform across every season of the year, and in many climates, the difference between a dry season load profile and a rainy season load profile is large enough to make or break the design.
The problem compounds in a particularly dangerous way. The two variables that define system performance, solar harvest and load demand, tend to move in opposite directions across seasons. In most tropical and subtropical regions, the rainy season brings reduced solar irradiance due to cloud cover at exactly the same time that lighting loads increase because of shorter effective daylight hours and overcast conditions. An air conditioning load that runs 4 hours per day in the dry season may run 2 hours per day in the rainy season, but that saving is often offset by increased lighting, increased refrigeration cycling due to humidity, and reduced solar input compressing the effective charging window.
What I do on every system design is run two complete load audits. The first is for peak solar season, which gives me the best-case energy balance. The second is for worst-case solar season, typically the month with the lowest average peak sun hours in the installation location. The battery bank and solar array are sized to satisfy the worst-case audit, not the average. Designing to the average means the system will underperform for several months every year.
The data for worst-case peak sun hours is available from NASA POWER, PVGIS, and SolarGIS for virtually any location on earth. I pull the monthly average peak sun hours for the installation coordinates and identify the lowest month. That number, not the annual average, is what goes into the solar array sizing calculation that follows the load audit.
Skipping seasonal analysis does not just risk poor performance in the off months. In some cases it results in a system that cannot meet critical load demand for weeks at a time, which for an off-grid installation is not an inconvenience but a failure.
Inverter Efficiency: The Hidden Tax on Every Watt
There is a calculation step that gets omitted from a surprising number of load audits, even ones done by experienced installers. When you sum up your AC load consumption in watt-hours and use that figure to size your battery bank, you are making an implicit assumption that every watt-hour stored in the battery arrives at the load without loss. That assumption is wrong, and the error it introduces scales directly with system size.

Every inverter has a conversion efficiency rating, typically expressed as a percentage. Quality pure sine wave inverters in the 3kVA to 10kVA range operate at between 90 and 94 percent efficiency at mid to full load. What this means in practice is that for every 1,000W your AC loads consume, the battery is actually delivering between 1,064W and 1,111W to cover that demand plus the inverter’s own conversion losses. The formal correction is expressed as:
E_battery = E_AC / n_inv
Where:
E_battery = actual energy the battery must deliver (Wh)

E_AC = total AC load energy demand from the audit table (Wh)

n_inv = inverter efficiency as a decimal (e.g., 0.92 for 92%)
Applying this to a real example: if your total daily AC load consumption is 5,000Wh and your inverter operates at 92 percent efficiency, the actual battery demand is 5,000 divided by 0.92, giving you 5,435Wh. That 435Wh difference is not trivial. On a system running 365 days a year, it represents over 158kWh of additional annual energy demand that your solar array and battery bank must account for.
The efficiency figure also changes with load level. Most inverters reach peak efficiency at 50 to 75 percent of rated load. At very light loads, below 10 percent of rated capacity, efficiency drops sharply, sometimes falling below 80 percent. This is why oversizing an inverter significantly relative to the actual load is not just a cost problem. It is an efficiency problem that increases battery cycling and reduces system autonomy.
In every load audit I complete, the total daily watt-hour figure gets divided by the inverter efficiency factor before it is used for battery sizing. This is not optional. It is a fundamental correction that every honest calculation must include.
Phantom Loads: The Silent Battery Killers
Phantom loads are the category of consumption that never appears on a load audit table because nobody thinks to put them there. They are not appliances running in active use. They are the background draws that exist simply because equipment is powered on, sitting in standby, or maintaining an idle state. In a grid-tied home they are a minor inefficiency. In an off-grid system they are a serious design variable that can account for a significant fraction of total daily energy consumption.

The most consistent offender I find on site is the inverter itself. A quality hybrid or off-grid inverter in standby mode, with no active loads running, draws between 10 and 30W continuously depending on the model and firmware. That sounds insignificant until you run the numbers. A 20W inverter standby draw operating 24 hours a day consumes 480Wh per day. That is the equivalent of running a 40 inch LED television for approximately 5 hours, every single day, without anyone in the room. On a system with a 10kWh battery bank targeting 80 percent usable capacity, that single phantom load consumes nearly 6 percent of available daily capacity before a single real load has been switched on.
Beyond the inverter, other common phantom load sources include MPPT charge controllers drawing 5 to 15W in idle, router and networking equipment drawing 8 to 15W continuously, security system control panels, battery monitoring displays, and any appliance left in standby mode such as televisions, set top boxes, and audio equipment. Individually these numbers seem trivial. Collectively they routinely add up to 50 to 100W of continuous background draw, which translates to 1.2 to 2.4 kWh per day of energy consumption that was never accounted for in the design.
The way I handle phantom loads in a load audit is to measure them separately using a clamp meter on the main DC feed from the battery with all AC loads switched off. Whatever the meter reads at that point is the system’s baseline phantom draw. I then add this figure as a fixed 24 hour load in the audit table before summing the total daily energy demand. You will notice I have already included inverter standby as a line item in the sample load audit table in Section 3. That is intentional. It belongs there on every audit, not as an afterthought.
Ignoring phantom loads does not just reduce system autonomy. On undersized systems it is often the difference between a battery that makes it through the night and one that hits the low voltage cutoff at 3am.
Load Diversity Factor
Load diversity factor is one of those concepts that sits at the intersection of electrical engineering and practical system behavior, and it is almost never discussed in off-grid design guides aimed at installers. That is a problem, because applying it incorrectly in either direction produces a system that either costs significantly more than it needs to or trips its inverter during normal morning operation.
The diversity factor is formally defined as the ratio of the maximum coincident demand of a group of loads to the sum of their individual maximum demands. Expressed as an equation:
DF = Maximum Coincident Demand / Sum of Individual Maximum Demands
Where:
DF = diversity factor (always less than or equal to 1.0)

Maximum Coincident Demand  = highest simultaneous load the system actually sees (W)

Sum of Individual Max Demands = sum of each load's individual peak draw (W)
In plain terms, it accounts for the fact that in any real installation, not every load reaches its peak draw at exactly the same moment. A household where the refrigerator compressor, the water pump, the washing machine, and the air conditioner are all running simultaneously at full load is theoretically possible but practically rare during normal operation.
Where diversity factor assumptions collapse most consistently is during morning startup. In my experience, the highest instantaneous demand on any residential off-grid system occurs in the first 30 to 60 minutes after the household wakes up. The kettle comes on, the microwave starts, lights are switched on, the refrigerator compressor cycles after a night of door openings, and in some cases a water pump activates to refill an overhead tank. This morning peak is where I have seen more inverter overcurrent trips than at any other time of day, precisely because the diversity factor that holds true for the rest of the day temporarily breaks down.
The practical approach I use is to apply a diversity factor of 0.7 to 0.8 for general load and battery sizing calculations, meaning I assume simultaneous peak demand will reach 70 to 80 percent of the sum of all individual peak loads. However, for inverter sizing specifically, I always check the morning peak scenario separately and size the inverter surge capacity to handle the worst credible simultaneous startup combination, not the diversified average. These are two different calculations serving two different purposes, and conflating them is what leads to both oversized battery banks and undersized inverters on the same installation.
Thermal Correction for Hot Climate Loads
If you are designing off-grid systems in tropical or hot arid climates, there is one more correction factor that needs to go into your load audit before you arrive at a final daily energy demand figure. Ambient temperature has a direct and measurable effect on the power consumption of certain load categories, and ignoring it means your audit is accurate for a temperate laboratory environment but not for the real installation site.
The load most affected by ambient temperature is air conditioning. An inverter air conditioner rated at 1,200W cooling capacity under standard test conditions, typically 35 degrees Celsius outdoor and 27 degrees Celsius indoor, will draw noticeably more current when outdoor ambient temperature climbs to 40 degrees Celsius or above. The compressor works harder and runs longer to maintain the same indoor setpoint. In practice I apply a thermal correction factor of 15 to 25 percent on top of the measured or rated draw for any air conditioning load in installations where peak ambient temperatures regularly exceed 38 degrees Celsius. For a 1,200W unit that means budgeting 1,380W to 1,500W in the load audit rather than the nameplate figure.
Refrigeration loads are similarly affected. A chest freezer or upright refrigerator in a hot kitchen or poorly ventilated utility room will run its compressor at a higher duty cycle than the same unit in a climate controlled space. I have measured duty cycles as high as 60 to 70 percent on refrigerators installed in rooms consistently above 35 degrees Celsius, compared to the 30 to 40 percent discussed earlier for normal ambient conditions.
Beyond cooling loads, battery charging equipment, particularly onboard chargers and DC-DC converters, also derate in high ambient temperatures due to thermal protection mechanisms. These are smaller contributors but worth noting on systems with significant auxiliary charging loads.
The correction is simple to apply. Identify every temperature sensitive load in the audit, apply the appropriate thermal factor based on expected peak ambient conditions at the site, and use the corrected figure in the daily energy calculation. It takes five minutes and can prevent a system from being undersized by a meaningful margin before a single panel is mounted.
From Load Audit to Battery Sizing
A load audit that stops at total daily energy consumption is only half finished. The number you have built through the previous nine sections is not the final destination. It is the input to the next critical calculation: how much battery capacity your system actually needs. This bridge is where the load audit earns its value, and I want to show you exactly how the numbers connect.
Starting from the corrected daily energy demand figure from your audit table, the battery sizing calculation introduces two additional variables: days of autonomy and depth of discharge. Days of autonomy is the number of consecutive days the battery bank must supply the full load without any solar input. For most residential off-grid systems in tropical climates I design for 1 to 2 days of autonomy, accounting for consecutive overcast days.
For critical installations I extend this to 3 days. Depth of discharge defines how much of the battery’s rated capacity is usable without causing premature degradation. For LiFePO4 chemistry I use 80 percent as the standard design DoD, meaning I never plan to draw the battery below 20 percent state of charge under normal operating conditions.
The battery sizing equation is:
Battery Capacity (Wh) = E_daily x Days of Autonomy / DoD
Where:
E_daily = corrected daily energy demand from the load audit (Wh)

Days of Autonomy = number of days battery must sustain load without solar input

DoD = maximum allowable depth of discharge as a decimal (e.g., 0.80)
Applying this to the sample audit from Section 3, where our corrected daily battery demand after inverter efficiency correction is approximately 4,326Wh (3,980Wh divided by 0.92), and designing for 2 days of autonomy at 80 percent DoD:
Battery Capacity (Wh) = 4,326 x 2 / 0.80 = 10,815Wh

To convert this to amp-hours at your system voltage, apply:

Battery Ah = Battery Wh / System Voltage

For a 48V system:

Battery Ah = 10,815 / 48 = 225Ah
This means your system requires a minimum 48V 225Ah lithium battery bank, which in practice you would round up to a 48V 250Ah or 48V 200Ah bank depending on available battery configurations and your preferred headroom. Every number in that final sizing result traces directly back to the load audit table you built in Section 3. That is the point. A clean audit produces a defensible, accurate battery size. A sloppy audit produces a system that either fails its owners or wastes their money.
Conclusion
A proper off-grid load audit is not a form you fill out once and file away. It is the engineering foundation that every other decision in the system design rests on. Battery capacity, solar array size, inverter rating, charge controller selection, fusing, and cable sizing all flow directly from the daily energy demand figure your load audit produces. If that number is wrong, the entire system is wrong, regardless of how carefully every downstream calculation is executed.
What I have walked through in this guide represents the load audit methodology I apply on every system I design, from small residential off-grid cabins to larger commercial installations. The principles do not change with scale. Measure rather than assume. Account for duty cycles rather than continuous draw. Separate load types and treat motor loads with the respect their inrush characteristics demand. Categorize by priority so your battery sizing protects what actually matters. Correct for inverter efficiency, account for phantom loads, apply a realistic diversity factor, adjust for thermal conditions at the installation site, and always bridge your audit result directly into a battery sizing calculation before you call the audit complete.
When you pull all of these corrections together into a single load audit table, what you end up with is not just a watt-hour number. You end up with a clear picture of how energy moves through the system across a typical day, where the peaks occur, which loads are negotiable and which are not, and what the system must deliver under worst-case conditions. That picture is what makes the difference between a system that performs reliably for ten years and one that disappoints from the first week of operation.
In the next post in this series, we will build directly on this foundation by examining the difference between peak load and average load, and why that distinction has more influence over your inverter selection than almost any other single factor in the design process.

Hi, i am Engr. Ubokobong a solar specialist and lithium battery systems engineer, with over five years of practical experience designing, assembling, and analyzing lithium battery packs for solar and energy storage applications, and installation. His interests center on cell architecture, BMS behavior, system reliability, of lithium batteries in off-grid and high-demand environments.