Introduction
Being in the solar space for well over 7 years, I’ve diagnosed this scenario dozens of times: a homeowner calls saying their battery bank died, but the display shows 60% state of charge. They built what looked like a solid system. Quality LiFePO4 cells, proper wire sizing, a well-reviewed BMS from Amazon. It worked perfectly for six months, maybe a year. Then runtime dropped. Evening loads that used to run four hours now cut out after two. The BMS shuts down with low voltage on one cell while pack voltage still reads 50V on their 48V system.
They assume defective cells. Sometimes they get replacements under warranty. The problem returns in six months.
What fails in nearly every case isn’t the cells, it’s the passive balancing BMS trying to manage a high-discharge solar energy storage system, an application it was never designed for.
The Silent Failure in Passive Balancing
Passive balancing works fine for consumer electronics and low-power applications with regular full charges. But high-discharge solar represents the worst possible use case, and the failure mode is nearly invisible until you’ve lost significant capacity.
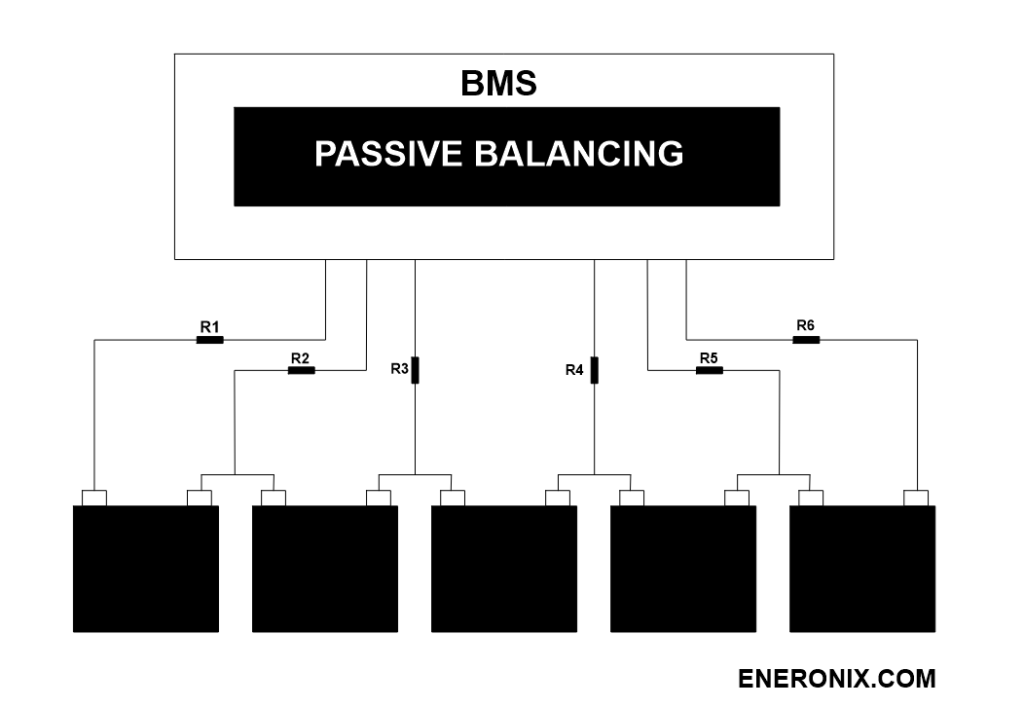
Here’s what passive balancing actually does: it uses resistors and MOSFETs to bleed excess charge from higher-voltage cells during charging. When the BMS detects a cell reaching 3.45V-3.65V (depending on design), it connects that cell across a resistor, dissipating energy as heat to bring voltage down relative to other cells.
The balancing current is almost always 50mA-200mA, with 100mA being most common. But a critical constraint is, passive balancing only happens during charging, and only after cells reach the threshold voltage. If your charge controller terminates at 3.45V per cell and the BMS starts balancing at 3.50V, you’ll never see balancing activity.
This works for a phone battery charging daily at 2-5A discharge. It fails catastrophically for solar storage.
1. The Math That Doesn't Work
Consider a typical residential setup: 48V, 300Ah LiFePO4 pack (16S configuration, 14.4kWh). Owner has a 5kW inverter pulling 2-4kW during 6-10pm peak usage.
At 3kW continuous load: 62.5A from the battery. At 4kW: 83A. These aren’t brief acceleration peaks; this is sustained discharge for four hours every evening. That’s 250-330Ah daily throughput.
Now assume cells start with minor manufacturing variation. Cell 7 has 295Ah actual capacity instead of 300Ah, less than 2% difference, well within tolerance.
During four hours at 62.5A, every cell delivers identical current (series connection). But Cell 7 cycles through a higher percentage of its capacity. When the pack has discharged 240Ah:
- Healthy cells: 80% depth of discharge (240/300)
- Cell 7: 81.4% depth of discharge (240/295)
Cell 7 hits the 2.8V low-voltage cutoff first. With LiFePO4’s flat voltage curve (only 0.05-0.1V difference across 20-80% SOC), when Cell 7 reaches 2.8V at 85% DOD, the other fifteen cells are still at 3.0V with 20% capacity remaining. The BMS correctly protects Cell 7 from over-discharge by disconnecting the entire pack.
The user just lost 60Ah of usable capacity because one cell couldn't keep up.
Their battery monitor shows pack voltage, an average. They see shutdown and wonder why their “300Ah battery” only delivers 240Ah.
Why Passive Balancing Can't Fix This
Next morning, solar charging brings the pack through bulk to absorption at 3.55V per cell (56.8V pack). Passive balancing activates, let’s assume 100mA per cell, three hours in absorption. That’s 0.3Ah bled from higher cells.
cell balancing technique limitations
But you're not fixing the capacity mismatch. You're just matching voltage at full charge.
Cell 7 still has 295Ah capacity. The balancing resistor can’t add capacity to a degraded cell, it can only bleed charge from stronger cells. Next discharge cycle: same problem. Cell 7 hits 2.8V first, pack shuts down early, same 60Ah capacity loss.
This is the fundamental limitation: passive balancing equalizes voltage, not capacity. If capacity imbalance stems from manufacturing variation or unequal aging, bleeding resistors can’t correct it.
It gets worse. That 5Ah capacity difference doesn’t stay at 5Ah. The weaker cell cycles deeper every day, hitting 85% DOD while others hit 80%. Deeper cycling accelerates degradation. Six months later, Cell 7 might be at 285Ah while others are at 298Ah. Now you have a 13Ah imbalance, compounding.
2. The Time Constant Problem
To correct a 10Ah imbalance at 100mA balancing current requires 100 hours of continuous balancing. You’re getting 2-3 hours daily when the pack reaches absorption (assuming good solar conditions and proper charge controller settings).
Also Read: How Smart BMS Balancing Algorithms Protect Lithium Battery Packs
At three hours per day, you need 33 days of perfect absorption charging to balance 10Ah. But during those 33 days, you’re cycling the pack daily, and the weaker cell degrades faster. You’re falling behind faster than you’re catching up.
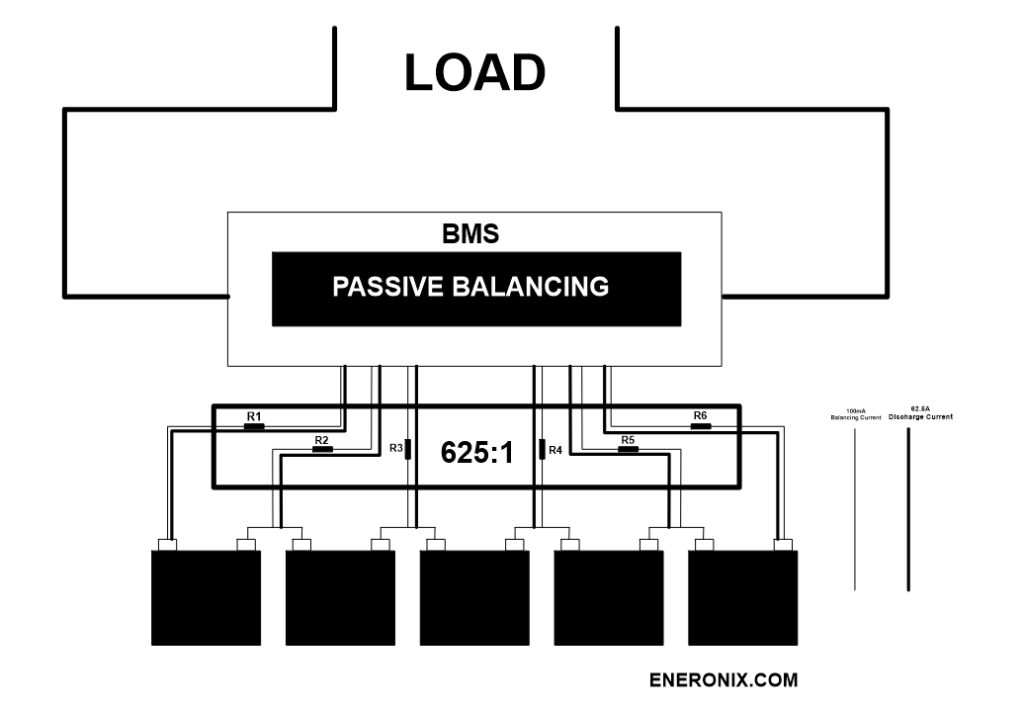
The core issue is the ratio of discharge current to balancing current. At 62.5A discharge and 100mA balancing: 625:1 ratio. You’re creating imbalance 625 times faster than you can correct it.
This works on paper only if discharge current is 2A and balancing is 100mA (20:1 ratio). But nobody runs a 48V, 300Ah pack at 2A discharge. They’re running 50-100A, and passive balancing cannot keep pace.
3. Voltage Masking
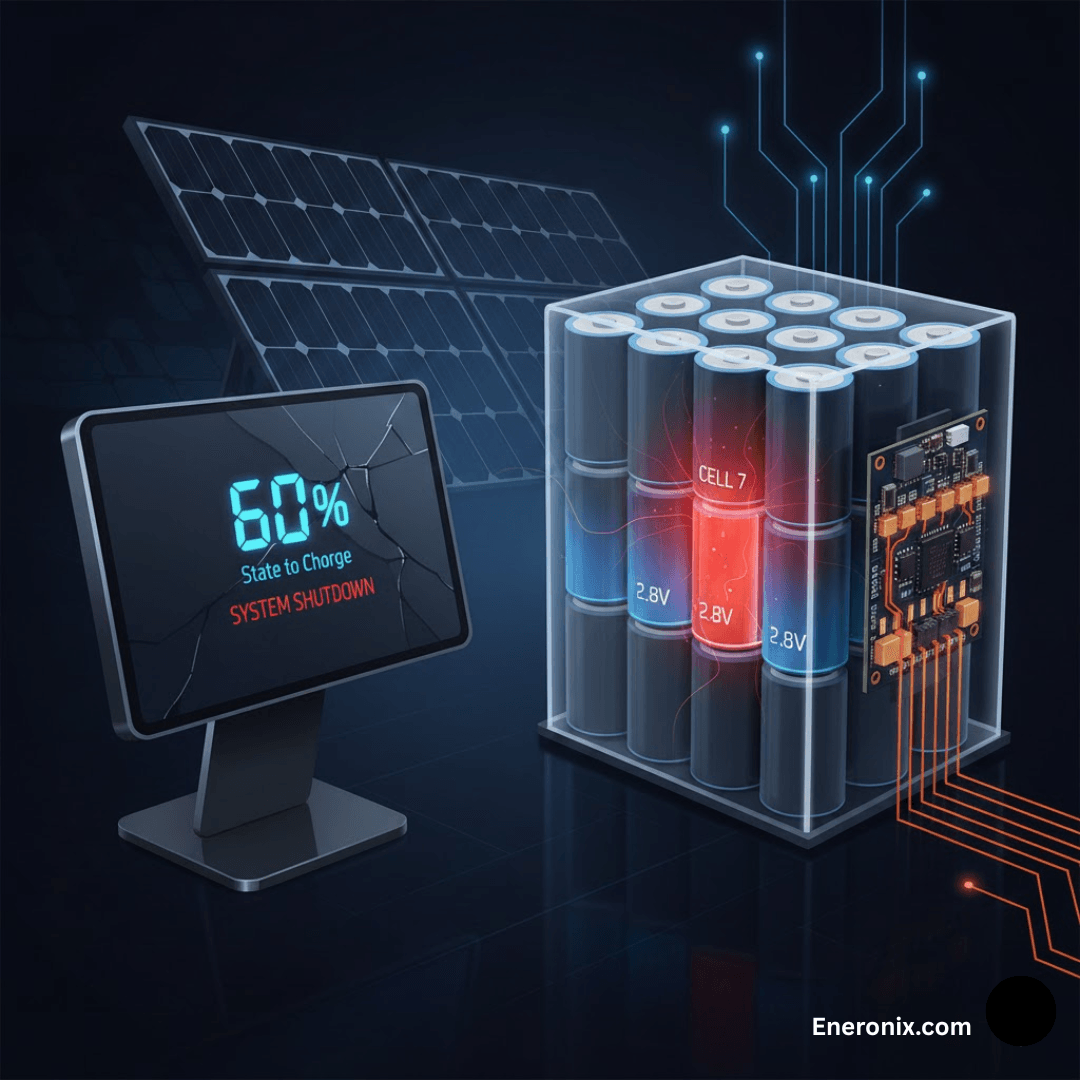
Here’s what makes this failure mode insidious, every BMS indicator looks normal until sudden failure.
Typical BMS display at 80% SOC:
Cell 1-16: 3.34-3.35V
Pack: 53.6V
Status: Normal
Balancing: Inactive
Everything appears fine. Voltages within 10mV. Pack voltage exactly right for 80% SOC.
But voltage tells you almost nothing about capacity in LiFePO4, especially mid-discharge.
A LiFePO4 cell at 80% SOC sits at ~3.32-3.35V. At 60% SOC: ~3.30-3.33V. That’s a 20% capacity difference showing as maybe 20-30mV voltage difference, well within normal measurement variation and temperature effects.
Your BMS measures voltage because it’s cheap: voltage sense lines, basic ADC chip, under $50 in components. Measuring actual capacity requires coulomb counting per cell, a current sensor on every cell, complex electronics, much higher cost. Consumer passive BMS units don’t do this.
Here’s what’s actually happening when the display shows “normal”:
Cell 7 degraded to 285Ah, others at 300Ah. After discharging 200Ah:
- Healthy cells: 33.3% SOC remaining (66.7% DOD)
- Cell 7: 29.8% SOC remaining (70.2% DOD)
That’s 3.5% state-of-charge difference. In voltage terms: 10-15mV at this curve point. BMS shows 3.32V for Cell 7, 3.33V for others, totally normal.
Discharge another 50Ah. Healthy cells at 16.7% SOC (~3.28V). Cell 7 at 12.3% SOC, dropping into the discharge curve knee (3.25V). BMS might show 30mV difference, still not alarming (temperature alone causes this).
Discharge another 20Ah. Healthy cells at 10% SOC (3.20-3.25V). Cell 7 at 5% SOC, voltage falling rapidly (2.95V). Now the BMS sees a problem, but you’re at failure edge.
Pull another 10Ah. Cell 7 hits 2.8V. BMS disconnects. Inverter shuts down. Loads go dark.
Pack voltage at disconnect: 51.2V, roughly 60-65% SOC based on pack voltage alone.
Fifteen cells sitting at 3.15-3.20V with 5-7% capacity remaining. Only Cell 7 is empty. The BMS correctly protected that cell, but from the user’s perspective, the system failed for no apparent reason.
4. Thermal Amplification
High discharge heating plus balancing resistor heating creates thermal stress that cheap BMS designs can’t handle.
During 62.5A discharge, a LiFePO4 cell with 0.5-1.5mΩ internal resistance dissipates 1.95-5.86W per cell. Across a 16S pack: 31-94W heat generation. In poorly ventilated enclosures, especially in direct sun, I’ve measured cell temperatures reaching 45-50°C during sustained discharge on 35°C days.
Now add balancing. At 100mA and 3.5V per cell, each resistor dissipates 0.35W. Across 16 cells on a small PCB (150mm × 50mm): 5.6-8W concentrated heat with minimal heatsinking. Board temperature easily reaches 60-70°C during active balancing; localized hotspots around resistors and MOSFETs run higher.
Most passive BMS designs mount directly to cell terminals for short sense wire runs. Heat from balancing circuits conducts directly into terminals. During absorption charging with active balancing, you’re simultaneously:
- Pushing charge current into warm cells from previous discharge
- Generating heat in balancing resistors
- Conducting that heat into cell terminals
I’ve measured cell terminal temperatures 15-20°C higher than cell body temperature during absorption with active balancing. LiFePO4 cells degrade significantly faster above 35°C; degradation accelerates exponentially above 45°C. At 50°C: 30-50% cycle life reduction versus operation at 25°C.
This creates a feedback loop. Cells running hottest age fastest, develop higher internal resistance, heat more during discharge, start each charge cycle hotter, making balancing resistors operate in hotter environments. The thermal variation itself drives progressive imbalance that passive balancing can’t correct.
What fails first varies by design:
- Undersized MOSFETs fail from continuous operation at 70°C junction temperature
- Undersized resistors desolder from thermal cycling
- Poor board layout causes copper trace lifting and cracked solder joints
- Cells themselves develop accelerated capacity fade from combined high temperature and deep cycling
Most users never see this. Their BMS has one thermistor measuring board temperature or stuck to one cell. That sensor reads 35°C while a MOSFET runs at 85°C and a cell terminal at 55°C two centimeters away.
The Failure Timeline
Month 0-6: System works beautifully. Cells have minor manufacturing variations (276-282Ah) within tolerance. Passive balancing activates during absorption, moving ~0.2Ah daily. Voltages stay within 5-15mV. But cells with slightly higher self-discharge or lower capacity are cycling 1-2% deeper daily. After 180 cycles, capacity spread grows to ~5Ah (275-280Ah, 1.8% variation). BMS still shows everything normal.
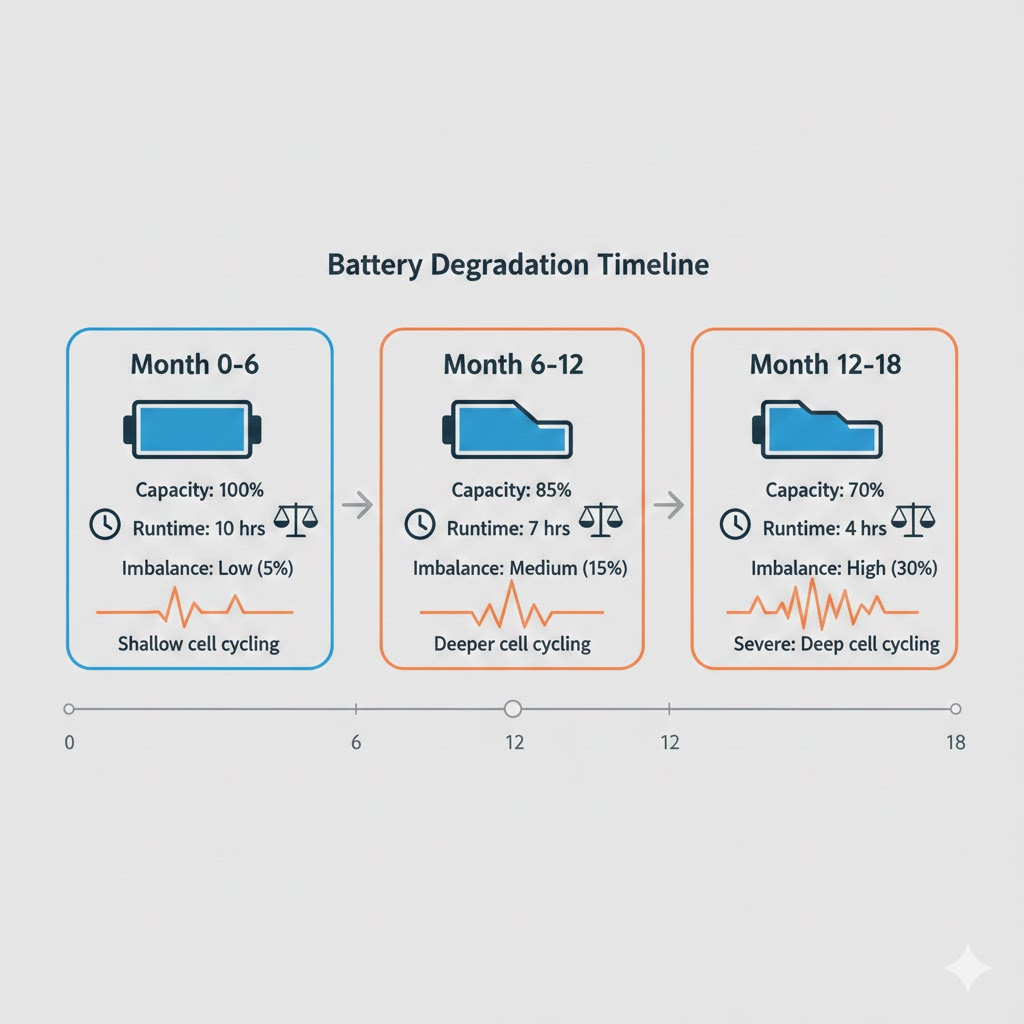
Month 6-12: Capacity spread large enough that the weakest cell hits different discharge curve points than strongest cells. Higher voltage sag under load, higher internal heating from cycling deeper into lower SOC range where internal resistance increases. Cell temperature 2-3°C higher than stronger cells. Weakest cell drops to 270Ah while strongest stay at 278Ah, 8Ah spread, almost 3% variation. Runtime noticeably decreasing, but BMS reports normal.
Month 12-18: Feedback loop fully engaged. Weakest cell at 270Ah cycling significantly deeper (74% DOD vs 72% for others during 200Ah discharge). Voltage difference under load becoming noticeable (30-50mV at 40-50% SOC). By month 15: 265Ah vs 276Ah (11Ah spread, 4% variation). Runtime dropped to three hours or less. BMS occasionally throwing early low-voltage warnings.
Month 18+: Weakest cell at 260Ah, strongest at 275Ah (15Ah difference, 5.5% variation). During normal 180Ah evening discharge, weak cell hits minimum voltage while stronger cells have 95Ah remaining, 34% of their capacity. System essentially unusable. BMS shuts down with pack voltage reading 60-65% SOC.
Detection Before Catastrophic Failure
- Check voltage spread at 50-60% SOC, not full charge. Discharge pack to ~51-52V (48V system), then check individual cell voltages immediately. If all cells within 20mV: capacity matching probably good. 30-50mV spread: developing imbalance. Over 50mV: significant mismatch requiring action. Check monthly. Track which cell is lowest and by how much.
- Runtime tracking with consistent loads. Every two months, run a test discharge at 30-50A until BMS cutoff. Record amp-hours delivered. For a 280Ah pack, expect 230-250Ah usable. If losing 10-15Ah in six months, that’s 3-5× expected degradation, indicates imbalance causing accelerated aging.
- Temperature monitoring during discharge and charge. Monitor at least four locations: cells at each end of series string, center of pack, near BMS. During sustained discharge, cells should stabilize 5-15°C above ambient. Over 40°C with ambient below 30°C indicates problems. Temperature differences between cells (one at 42°C while others at 35°C) means that cell is aging faster.
- BMS data logging analysis. If your BMS supports logging: How often is balancing active and for how long? Constant 3–4-hour balancing means cells diverging faster than BMS can correct. What’s voltage spread during charging? Growing spread over weeks means balancing not keeping pace. What voltage does lowest cell hit at cutoff? If pack voltage at cutoff is 52-53V instead of 50-51V, severe imbalance.
When Passive Balancing Can Work
Passive balancing isn’t inherently bad, it’s misapplied. It works when:
- Discharge rate below 0.3C with daily full charges. A 400Ah pack running a 1kW inverter (20A) has a 200:1 ratio instead of 1000:1. Time constant works better.
- System reaches full charge daily and holds absorption 3-4 hours. Many systems don’t do this, but if yours does, passive BMS can maintain balance.
- Starting with well-matched cells (preferably capacity-tested before assembly). If manufacturing variation is minimal and thermal environment controlled, passive balancing can maintain that match for years.
Most residential solar doesn’t meet these conditions. Arrays sized for 100-120% of average consumption are undersized for winter/cloudy weather. Packs don’t reach full charge daily. Discharge rates are high relative to balancing capability. Thermal environment is uncontrolled. Cells are budget grade with unknown variation.
Practical Design Guidance
For discharge rates below 0.3C: Quality passive BMS can work. Require ≥100mA per cell balancing current. Configure charge controller for 3.55V absorption, 3–4-hour absorption time. Monitor cell voltages monthly.
For discharge rates 0.3-0.5C or irregular charging: Use active balancing. Additional cost justified. Look for ≥5A balancing current, balancing during all operating modes (not just charging).
For discharge above 0.5C or packs >500Ah: High-current active balancing (≥10A). Consider per-cell monitoring and capacity-based SOC estimation.
Critical BMS specifications to demand:
- Balancing current per cell under continuous operation (sustained for hours, not peak)
- Maximum sustainable discharge rate as function of balancing current
- Required charge profile: absorption voltage, duration, frequency
- Thermal limits with real-world context (not just “operating temperature: -20°C to 60°C”)
Charge controller configuration for passive balancing:
- Absorption voltage: 3.55-3.60V per cell (must exceed balancing threshold)
- Absorption time: minimum 3 hours, preferably 4
- Weekly equalization charge to 3.65-3.70V for 1-2 hours
- Disable or minimize temperature compensation (prevents voltage drop below balancing threshold)
Conclusion
The passive balancing BMS failure in high-discharge solar isn’t a mystery—it’s predictable physics. A 100mA balancing current cannot maintain cell matching when discharge currents run 50-100A. The 500-1000:1 ratio means imbalance accumulates faster than correction occurs. LiFePO4’s flat voltage curve masks the developing capacity mismatch until one cell hits cutoff while pack voltage still shows 60% charge.
This isn’t about “cheap Chinese cells” or bad luck. It’s about fundamental mismatch between BMS capability and application requirements. Manufacturers market passive BMS for “high-power solar” based on current rating alone, burying the fact that 100A charge/discharge capability says nothing about 100mA balancing adequacy.
If you’re specifying a system: match BMS balancing capability to actual discharge profile, not just electrical ratings. If you’re diagnosing premature failure: check cell voltage spread at 50% SOC and compare runtime over time. If you’re operating an existing system: verify charge controller settings enable balancing and monitor for developing divergence.
The difference between an eight-year pack life and two-year failure isn’t luck. It’s appropriate BMS selection, proper system configuration, and active monitoring of what voltage alone cannot reveal.

I am Engr. Ubokobong Ekpenyong, a solar specialist and lithium battery systems engineer with over five years of hands-on experience designing, assembling, and commissioning off-grid solar and energy storage systems. My work focuses on lithium battery pack architecture, BMS configuration, and system reliability in off-grid and high-demand environments.