Why 100% Maximum Usable Capacity is a Lithium Battery Death Sentence
Chasing maximum usable capacity is degrading your lithium battery bank prematurely. We reveal the cycle life cost of 100% DoD and provide field-tested BMS voltage limits and sizing strategies for true long-term performance.
I’ve watched a 280Ah LiFePO4 Lithium Battery bank drop to roughly 220Ah of usable capacity in just eighteen months. The system was built exactly to the datasheet. The BMS protected the cells. The installer followed every best practice. The customer simply wanted the capacity they paid for.
That outcome isn’t an exception it’s a pattern I see repeatedly. Systems are configured for maximum extractable capacity, run entirely within BMS voltage limits, and initially deliver rated performance. Then, quietly, degradation sets in. It’s slow enough to go unnoticed until one day, a system that once handled daily loads without issue triggers low-voltage cutoffs with 30% state of charge still showing.
This isn’t about poor-quality cells or careless installation. It’s about a fundamental mismatch between how lithium battery cycles are configured and what that configuration costs in cycle life. The industry sells maximum usable capacity. Customers expect to use all of it. The consequences don’t appear on the invoice they show up two or three years later, when warranty conversations begin.
I’ve spent over five years designing and building lithium battery systems in real-world conditions: high heat, daily deep cycling, inverter surges, and minimal maintenance. In practice, the gap between datasheet claims and real-world performance comes down to one decision: how much of the rated capacity you actually try to use.
Maximizing usable capacity makes sense customers want every amp-hour but it quietly accelerates degradation. Push voltage extremes, cycle deeply every day, and the chemistry inside the cells pays the price long before warranty conversations happen.
In my experience, systems configured for slightly less aggressive use, routinely outlast “full-capacity” systems, delivering more total energy over their lifetime. The lesson is simple: running within BMS limits isn’t the same as running within what the cells can truly handle.
If you’re sizing systems, setting BMS parameters, or wondering why lithium batteries underperform long before their rated cycles, here’s the reality: more isn’t always better. Using less per cycle often gives you more over the long haul.
The Misconception: Standard Approach to Lithium Battery Charge-Discharge Cycles
The operating assumption is simple: if the datasheet says 280Ah, you should be able to use 280Ah. Rated capacity equals usable capacity. Anything less feels like waste.
This thinking drives system configuration across the industry. BMS voltage limits often become de facto operating limits. If the BMS allows 2.5V to 3.65V for LiFePO4 cells, that becomes the working range. The boundaries exist, so people use them. Most BMS interfaces give no indication that these limits represent “maximum safe extremes” rather than a recommended operating window.
The industry reinforces this approach constantly. Marketing emphasizes “100% depth of discharge capability” as a selling point. Battery specs list total capacity 280Ah, 304Ah without discussing operating windows or cycle-life trade-offs. The message is technically accurate but practically misleading: unlike lead-acid, where using more than 50% capacity rapidly shortens life, lithium appears to let you use everything but at a hidden cost.
Solar system sizing assumes full capacity utilization. A 12kWh daily load is matched to a 15kWh battery for margin. If you configure the system to stop at 90% SOC and start load-shedding at 20%, you effectively shrink that 15kWh system to 10.5kWh. Installers then face a choice: spec a bigger battery and risk losing the bid, or configure for full capacity use and move forward.
BMS voltage settings give zero guidance on long-term consequences. Typical interfaces allow low-voltage cutoffs from 2.5V to 3.0V and high-voltage cutoffs from 3.45V to 3.65V. Few warn that discharging to 2.5V versus 3.0V can cost 60% of cycle life.
The settings exist, the BMS accepts them, and the assumption is that “if it’s allowed, it must be reasonable for regular use.”
The standard field configuration I see is: 3.65V charge cutoff, 2.5V discharge cutoff, no SOC-based restrictions beyond voltage limits, complete reliance on BMS protection. It’s not reckless it’s extracting the capacity that was paid for, using the limits the equipment provides.
For the first year or two, this works perfectly. The system delivers rated capacity. Monitoring shows 0–100% SOC. Loads are met. Customers are satisfied. No alarms. No visible warnings. Everything behaves as the datasheet promised.
The degradation is gradual and often unnoticed: 280Ah drops to 265Ah, then 250Ah. Only when usable capacity falls below daily load when a system that reliably delivered 12kWh now cuts out at 10kWh do the questions start. By that point, you’re 18–24 months in, hundreds of cycles deep, and the damage is done.
Why Maximum Depth of Discharge Became Standard Practice
The push for maximum usable capacity in lithium battery systems isn’t irrational it’s driven by economics, industry messaging, and the realities of how systems are specified and sold.
Cost per kWh drives decisions.
When lithium cells cost $100 to 150 per kWh at the system level, every kilowatt-hour left unused represents wasted investment. A 15kWh battery configured for 70% depth of discharge (DoD) effectively costs 43% more per usable kWh than the same battery configured for 100% DoD. In competitive bidding, the installer who can deliver the same usable capacity for less money usually wins. The incentive structure naturally pushes toward maximum utilization.
Marketing reinforces the mentality.
Lithium batteries are sold on the promise that full capacity is usable, unlike lead-acid, where 50% DoD was the practical limit. “100% usable capacity” appears in product literature, sales presentations, and specification sheets. Technically accurate but practically misleading. Deep-cycling lithium doesn’t destroy the cells immediately, but it accelerates degradation over time. Customers and installers often interpret “usable” as “intended for continuous full discharge.”
Datasheet cycle life numbers add to the misunderstanding.
Typical LiFePO4 datasheets promise 3,000+ cycles, sometimes 4,000–6,000, depending on the manufacturer. What’s often buried or omitted entirely is that these ratings assume controlled conditions: 25°C operating temperature, 80% DoD, 0.5C charge/discharge rates, and capacity measured to 80% of the initial rating. The headline number gets used in system design, while the conditions under which it’s valid are ignored.
System sizing conventions assume full capacity.
Load calculations often work backward from energy consumption: a 12kWh daily load requires a 15kWh battery with 20% margin. If configured conservatively at 70% DoD, the system becomes undersized. The installer then faces a choice: spec a larger battery (higher cost, harder to sell) or configure for full capacity and move on.
Customers comparing quotes will question paying more for a larger battery. Explaining that a smaller operating window protects long-term cycle life often sounds like an excuse for overcharging. The installer who configures aggressively and meets the lower price usually wins the business.
BMS voltage ranges create false confidence.
If a BMS allows a 2.5V low-voltage cutoff and 3.65V high-voltage cutoff, it’s reasonable to assume continuous operation within those limits is safe. Most BMS documentation lists these as “operating voltage ranges,” without distinguishing between “maximum safe extremes for occasional use” and “recommended sustained operating window.” The system accepts the settings, operates normally, and provides no feedback that you’re trading cycle life for capacity.
Degradation is gradual and often invisible.
A system configured for 100% DoD doesn’t fail in the first few months. Usable capacity might drop from 280Ah to 270Ah, then 260Ah. Daily loads continue to be met, monitoring shows normal operation, and no alarms trigger. Only when the system can no longer support required loads typically 18–24 months in do questions arise. By then, the configuration decisions are forgotten, and blame shifts to “defective cells” or warranty issues.
Customer expectations are simple but rigid.
They paid for 15kWh and expect to use 15kWh. Telling them to limit use to 10.5kWh for longevity is technically correct but commercially difficult, especially when competitors aren’t having that conversation.
Voltage limits are listed (2.5V min, 3.65V max), but few datasheets quantify how operating at those extremes affects cycle life. The difference between 80% and 100% DoD under real-world conditions higher temperatures, varied C-rates, daily cycling is rarely explained. Installers assume that if the BMS and datasheet allow it, it’s appropriate for continuous use.
The combination of economic pressure, marketing promises, competitive dynamics, BMS confidence, and incomplete documentation naturally drives maximum depth-of-discharge configurations. It’s not negligence it’s rational behavior given the information and incentives in the field.
The Real Behavior of Lithium Battery Charge-Discharge Cycles at Voltage Extremes
In practice, what happens inside lithium batteries rarely matches the neat numbers in datasheets. Datasheet ratings assume ideal conditions 25°C, controlled charge/discharge rates, and partial depths of discharge. Field conditions, especially in solar installations, are far messier, and operating at voltage extremes accelerates degradation in ways that aren’t obvious from monitoring screens.
High-Voltage Stress Mechanisms (Top 10% SOC)
One of the most overlooked factors is high-voltage stress. For LiFePO4 cells, SEI (solid electrolyte interphase) layer growth accelerates once the voltage exceeds roughly 3.5V per cell; for NMC chemistries, degradation kicks in above 4.1V. The higher the voltage, the faster the electrolyte decomposes and the electrodes age.
Temperature magnifies this effect. In real solar systems, batteries aren’t cycling in a 25°C lab they sit inside enclosures at 35 to 45°C. During charging, especially at high rates, the cell temperature can run another 5 to 10°C above ambient. SEI growth, metal dissolution, and electrolyte breakdown follow an Arrhenius relationship: roughly doubling for every 10°C rise. Time spent at high voltage matters more than the number of cycles. A battery left at 100% SOC during low-load periods accumulates degradation steadily, even without active cycling. In other words, “floating” at top-of-charge is a silent killer.
Low-Voltage Damage Pathways (Bottom 10% SOC)
The other end of the voltage spectrum is equally destructive. Discharging below 2.8V in LiFePO4 cells introduces copper dissolution, electrode stress, and potential structural damage from deep lithiation. Voltage sag under load makes true state-of-charge (SOC) tricky to track; what the BMS reports as 10% SOC could be pushing individual cells to unsafe levels.
Series-connected batteries are particularly vulnerable. The weakest cell in the string hits the lower voltage first. If it approaches 0% SOC while the stronger cells continue delivering current, the weak cell experiences extreme stress. In the worst case, it can reverse polarity temporarily—a damaging event that permanently reduces capacity. In practice, I see series strings where one weak cell dictates the usable capacity of the entire pack, long before the pack voltage triggers alarms.
Temperature Amplification
Temperature is the multiplier of degradation. Solar batteries are exposed to high ambient temperatures, and enclosure temperatures frequently reach 35–45°C. The chemistry responds exponentially: every 10°C increase roughly doubles the degradation rate. High voltage plus elevated temperature creates the worst-case scenario, compounding both SEI growth and electrode stress.
In operation, battery temperatures often exceed ambient by 5–10°C due to internal resistance and charging currents. Even a “moderate” 40°C environment can effectively behave like a 50°C lab test, dramatically shortening cycle life if voltage extremes are used daily.
The Imbalance Cascade
Degradation isn’t uniform across cells. One weak cell in a series string determines pack performance. It hits voltage limits first, experiences more stress, and degrades faster than the rest. This creates a self-reinforcing imbalance loop: the weak cell’s accelerated aging reduces usable capacity for the entire pack, forcing the system to cut off earlier and skewing current distribution across the string.
Passive balancing 50–100mA trickle currents is inadequate to correct the imbalance accumulated from daily cycling at extreme voltages. A BMS reports pack SOC based on averages, but what truly matters is the weakest cell’s SOC. Ignoring this difference is a major reason why batteries “fail early” relative to rated cycles.
Real-World Numbers
The contrast between theoretical and real-world cycle life is stark. For LiFePO4 cells:
3,000 cycles are achievable at 80% DoD under ideal conditions.
At 100% DoD, real-world cycle life drops to roughly 800–1,200 cycles, depending on temperature and load.
Chasing maximum usable capacity running top-to-bottom voltage extremes every day can cut cycle life by two-thirds or more.
In practice, slightly limiting depth of discharge, avoiding prolonged high SOC, and keeping operating temperatures in check delivers far more total energy over the battery’s lifetime, even if the day-to-day SOC swing feels conservative.
Why Aggressive Lithium Battery Charge-Discharge Cycles Fail in the Field
Pushing lithium batteries to their extremes every day has consequences that often remain invisible until it’s too late. What starts as a high-performing system gradually becomes unreliable, frustrating both installers and end-users. The patterns I see most often are consistent across chemistries and installation environments: premature capacity fade, stranded energy under load, SOC estimation collapse, single-cell failures, and overall system unreliability. Understanding these failure modes is key to extending solar battery lifespan and designing systems that deliver predictable energy over years not just months.
In aggressive cycling scenarios, usable capacity can drop to 80% in just two years even when the datasheet suggests eight or more years of service. Initially, systems work perfectly: daily loads are met, SOC ranges appear normal, and monitoring shows no alarms. Then, suddenly, the system seems to “forget” its capacity. Customers ask, “What changed? I’m using it the same way.”
The reality is cumulative chemical and mechanical damage crossing a threshold. High-voltage stress, deep discharge events, and thermal cycling slowly degrade electrodes, electrolyte, and the SEI layer. For LiFePO4 batteries, this means that after 18–24 months of daily 100% depth-of-discharge cycles, the pack enters a rapid decline phase, where previously invisible wear manifests as lost amp-hours and frequent BMS intervention.
Stranded Capacity Under Load
Voltage sag at high C-rates is another silent problem. Even when the SOC meter shows 30% remaining, the battery may refuse to deliver sufficient power, especially under inverter surge loads like motor starts or compressors. This dynamic usable capacity gap grows as the cells degrade: the system can no longer reliably support high-demand loads, even though static capacity appears adequate on monitoring dashboards.
In practice, this is when users start calling installers for “battery problems” that aren’t due to hardware defects but to cumulative degradation from aggressive usage.
SOC Estimation Collapse
Lithium iron phosphate’s (LFP) famously flat voltage curve complicates SOC estimation. Below 20% SOC, voltage-based readings become nearly meaningless. Coulomb-counting methods drift without regular calibration, and as cells age, the voltage-to-SOC relationship shifts further.
This is when BMS battery management fails at the worst possible moment. The system can no longer provide accurate state-of-charge information, undermining confidence in both energy planning and system safety. The pack might cut off unexpectedly, even when there’s still usable capacity remaining.
Single Cell Failure
One weak cell often dictates the fate of the entire pack. In series strings, the first cell to degrade limits usable capacity. Continued deep discharges can lead to cell reversal, which is catastrophic if prolonged. Thermal events are also more likely in degraded cells under stress.
I’ve seen perfectly good neighboring cells rendered irrelevant because a single cell failed early. The pack as a whole loses performance, even though most cells still have significant remaining capacity. In fielded solar systems, this phenomenon is one of the main reasons aggressive cycling leads to premature warranty claims.
System Unreliability
Cascading from these issues is general system unreliability. Nuisance BMS trips increase, available capacity becomes unpredictable, and load-shedding occurs at unexpected times. End-users lose confidence, often resorting to emergency generators to bridge perceived gaps in solar supply.
This loss of predictability is exactly what undermines solar battery lifespan in practice. It’s not just about the chemistry mechanical, thermal, and BMS management realities all interact. A pack that was over-cycled daily may still physically exist, but its operational utility and reliability can fall far short of expectations.
Aggressively chasing maximum usable capacity accelerates degradation, triggers early BMS interventions, and ultimately reduces the system’s practical lifetime. The result is a solar battery system that initially performs well but becomes increasingly unreliable, confusing users, and generating maintenance headaches. Designing for slightly more conservative voltage windows, careful depth-of-discharge management, and realistic BMS battery management practices is the difference between systems that fail prematurely and those that deliver stable, predictable energy over years.
Usable Capacity vs Longevity
In practice, every system I work on comes down to one unavoidable equation:
Capacity × Cycle Life = Lifetime kWh delivered.
It’s simple on paper, but rarely applied rigorously in the field. Most people chase 100% depth-of-discharge because it “feels like getting the most for the money.” But the numbers tell a different story.
Consider two scenarios with a 10kWh LiFePO4 bank:
100% DoD × 1,000 cycles = 1,000 full-cycle equivalents
60% DoD × 4,000 cycles = 2,400 full-cycle equivalents
The second system delivers more than double the energy over its lifetime, despite never hitting the top or bottom of the pack. In practice, that translates to far fewer premature replacements and less downtime, even if it means the pack looks “underused” day-to-day.
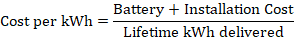
The real economics come from cost per lifetime kWh delivered, not upfront capacity:
Oversizing a system for conservative cycling often results in lower effective cost per kWh despite higher upfront expense. Include replacement labor which can be 30–50% of the battery equipment cost and the advantage becomes even clearer. What feels like “wasted capacity” is actually an insurance premium against early degradation.
Calendar aging complicates the picture. LFP loses 2–3% capacity per year regardless of cycling, so you can’t simply oversize infinitely and run the bank shallow forever. In real-world solar installations, the sweet spot tends to be oversizing 50–80%, not 200%. Too much oversizing adds cost and reduces efficiency without proportionally extending usable energy.
Context matters. High-temperature environments enclosures reaching 40–45°C, panels heating nearby packs make conservative cycling essential. SEI layer growth, electrolyte breakdown, and metal dissolution accelerate dramatically under these conditions. Conversely, systems running in controlled temps (<25°C) can tolerate more aggressive cycling without catastrophic loss, though some degradation is still unavoidable.
Daily cycling amplifies the trade-off. The more often the pack is cycled, the faster the cumulative damage accumulates at high DoD. Occasional-use systems weekend cabins, backup power can accept deeper cycling without drastically shortening service life, because the total number of cycles remains low.
The real-world takeaway: paying 40% more upfront for a battery configured with moderate DoD often yields 150–200% more lifetime energy delivered. It’s not a question of “wasting capacity” it’s about extending usable energy, minimizing replacements, and reducing operational headaches.
In systems I’ve built and monitored, this approach typically produces ROI within 12–24 months in daily-cycling solar applications. The BMS settings become less about extracting every amp-hour today and more about preserving reliability and total delivered kWh over the system’s expected lifetime.
In short: running a pack to its limits maximizes day-one capacity but guarantees early degradation. Running conservatively costs a little today and pays back many times over in years of dependable service. That trade-off is the reality of engineering lithium battery systems in the field.
Configuring Lithium Battery Charge-Discharge Cycles for Real-World Longevity
When configuring solar energy storage systems, I rarely start with datasheet numbers. The focus is always:
How the system will actually be used
Ambient temperatures
Load characteristics
Lithium battery chemistry tolerates extremes in the lab, but in the field, high voltage, deep discharge, and elevated temperatures accelerate degradation far faster than most installers anticipate.
Understanding the interplay between depth of discharge (DoD), SOC range, temperature, and load is critical. Below are practical guidelines for configuring lithium battery cycles in real-world solar installations.
By Chemistry
Chemistry
Conservative SOC
Moderate SOC
Aggressive SOC
Notes
LFP (LiFePO4)
10–90% (3.0–3.5V per cell)
5–95% (2.8–3.55V per cell)
0–100%
Aggressive only if <25°C and daily energy throughput is low
NMC (Nickel Manganese Cobalt)
20–80% (3.7–4.0V per cell)
10–90% (3.5–4.1V per cell)
0–100%
Avoid aggressive cycling; high voltage + temp reduces cycle life
Voltage targets I use in practice:
Top balance: 3.45V
Bottom cutoff: 3.0V (LFP) / 3.5V (NMC)
Hitting the extremes daily is the single biggest factor in accelerating degradation.
By Application
Daily Solar Cycling
Target SOC: 30–70% for daily use
Monthly calibration cycle: 10–90% SOC to correct SOC drift and maintain BMS accuracy
Battery sizing: daily load ~40% DoD (not 80–100%)
Example: 12kWh daily load → minimum 30kWh bank → operate in mid-40% range
Backup / Standby Systems
Storage SOC: 40–60% to minimize calendar aging
Deeper cycling during outages only: 10–90% SOC occasionally
Monthly exercise cycles maintain BMS accuracy and balance
High-Power Inverter Applications
Account for voltage sag at high C-rates: expect 15–20% derate
Avoid 100% DoD: inverter cannot pull rated load from last 10–15% capacity
Calibration cycles: monthly (daily cycling) or quarterly (light use)
Balance current: passive balancing requires 8–12 hours at high SOC minimum
System Sizing Philosophy
The old approach matching battery size to daily load and configuring for 100% DoD—maximizes day-one capacity but guarantees early degradation. A more durable approach:
Example:
Daily load: 12kWh
Target DoD: 50%
Minimum battery: 24kWh
At 80% EOL capacity: 19.2kWh × 50% = 9.6kWh → still meets ~80% of daily load
Takeaways:
Oversizing modestly ensures that, even after degradation, the system meets energy needs without stressing voltage extremes daily
Conservative SOC ranges + chemistry-specific limits + mid-range cycling deliver more lifetime energy than chasing full capacity
Aggressive cycling may feel efficient on paper, but degradation, BMS interventions, and thermal stress quietly erode both lifetime kWh delivered and reliability
The Lithium Longevity Checklist: Real-World BMS Settings
Don’t let your BMS settings be a death sentence for your cells. Use these targets to move from “maximum usable capacity” to maximum lifetime value.
1. Voltage Thresholds (The Damage Zones)
LFP Top-Balance Limit: Set to 3.45V per cell. Avoiding the datasheet max of 3.65V stops accelerated SEI layer growth and electrolyte breakdown.
LFP Bottom-Cutoff Limit: Set to 3.0V per cell. Discharging to the “allowed” 2.5V can cost you up to 60% of your total cycle life.
NMC Operating Window: Keep between 3.5V and 4.0V per cell. High-voltage stress above 4.1V is a silent killer for NMC chemistries.
2. SOC Windows (Daily Operating Ranges)
Daily Solar Cycle: Aim for a 30%–70% SOC swing. Running top-to-bottom every day can cut cycle life by two-thirds.
The “Safety Buffer”: Configure for a 10%–90% window for occasional deeper needs. This 20% “unused” capacity is actually an insurance premium against early degradation.
Standby/Backup Storage: Maintain at 40%–60% SOC to minimize calendar aging during long periods of inactivity.
3. Critical Management Practices
Monthly Calibration: Perform one 10%–90% cycle every 30 days. This corrects “SOC drift” and prevents the BMS from cutting power unexpectedly when it “thinks” there is 30% left.
The Weak-Cell Rule: Monitor individual cell voltages, not just the pack average. One weak cell in a series string dictates the usable capacity and failure point of the entire pack.
Temperature Compensation: If your enclosure exceeds 35°C (95°F), you must narrow your SOC range. Degradation rates roughly double for every 10°C rise in temperature.
4. System Sizing Math (The ROI Formula)
Target DoD: Size your battery so your daily load represents only 40%–50% Depth of Discharge.
Lifetime ROI: A battery limited to 60% DoD can deliver 2.4x more total energy over its life compared to one pushed to 100% DoD daily.
Reframing the Value of Conservative Lithium Battery Charge-Discharge Cycles
The shift in perspective is subtle but critical. This isn’t about leaving energy on the table it’s about reserving capacity for longevity. It’s not “paying for unusable kWh”; it’s buying insurance against early replacement, downtime, and frustration.
In my experience, the metric that truly matters is cost per kWh delivered over the system’s lifetime, not the day-one amp-hours.
Hidden Costs of Aggressive Cycling
Pushing batteries to 100% depth-of-discharge (DoD) daily hides a range of costs that rarely appear in quotes:
Replacement labor: often 30–50% of equipment cost. Even under warranty, pulling, replacing, and rebalancing packs is time-intensive.
System downtime: lost productivity, unexpected generator fuel use, or curtailed solar output.
Disposal/recycling: degraded packs aren’t free to dispose of.
Installer reputation: callbacks, warranty claims, and unhappy customers accumulate faster than anyone budgets for.
User stress and system unreliability: the pack may show 30% SOC but refuse to deliver power, triggering alarms and uncertainty.
In practice, these “soft costs” often outweigh the marginal kWh gained from aggressive cycling.
Real ROI of Conservative Operation
A slightly counterintuitive truth: running conservatively pays off faster than it looks. In daily-cycling solar systems:
Typical payback: 12–24 months for moderate oversizing and mid-range SOC cycling.
Useful life extension: 2–4× in hot climates.
Predictable performance: reduces service calls, protects installer reputation, and keeps customers confident.
Systems configured for longevity don’t just last longer they deliver more total energy over their lifetime than packs pushed to the limits. Fewer failures, fewer callbacks, fewer unexpected cutoffs that’s the real value.
Practitioner Recommendations
To design systems that last and perform reliably:
Accept that rated capacity is a theoretical maximum, not an operating target.
Treat system reliability and longevity as features worth paying for.
Aim for practical reality: 70% usable capacity for 10 years is far more valuable than 100% usable for 3 years.
Action Items for Installers and System Designers
Audit current systems: check voltage limits, SOC windows, and BMS cutoff behavior.
Assess operating temperatures: enclosure temperatures matter more than ambient air high internal heat shortens life.
Evaluate cell balance and monitoring: pack-level SOC hides weak-cell stress.
Reconfigure conservatively for longevity (>5 years): modest DoD, mid-SOC cycling, and monthly calibration.
Size future systems with longevity built in: oversize slightly, limit daily DoD, and avoid pushing voltage extremes.
Field Reality
The batteries you baby will outlast the ones you push and deliver more energy over their lifetime. Systems that run conservatively, respect temperature and voltage limits, and manage DoD carefully avoid early degradation, reduce user headaches, and produce a far higher total return both in energy and reliability than chasing maximum day-one capacity ever will.
The FAQ
Q: The datasheet promises 3,500 cycles at 100% DoD. Are you saying the manufacturer is lying?
A: They aren’t lying; they are “marketing.” Those 3,500 cycles happened in a lab at a steady 25 degrees, at a C/10 discharge rate, using a high-precision power supply. Your battery lives in a 40 degrees shed, gets hit with a 5,000W inverter surge when the well-pump kicks in, and is managed by a $50 BMS. In that environment, “100% DoD” is a death sentence. You aren’t buying 3,500 cycles; you’re buying a fast-track to copper dissolution and SEI layer bloating.
Q: If I stay in the 20–80% "Safe Zone," won't my SOC meter eventually become a work of fiction?
A: Absolutely. This is the SOC Drift trap. Because LFP has an incredibly flat voltage curve, your BMS relies on “Coulomb Counting” (guessing based on current flow). Over weeks of mid-range cycling, the math errors accumulate.
The Professional Fix: You don’t need to deep-cycle daily, but you must hit a full 100% charge once a month to reset the BMS “Full” flag. If you don’t, your BMS might report 30% remaining when the cells are actually screaming at 0%.
Q: My BMS has built-in passive balancing. Why isn't that enough to keep cells healthy?
A: Because the math doesn’t work. Most passive balancers bleed off a pathetic 50mA. If one cell in your 280Ah pack is just 1% out of sync (2.8Ah), that balancer would need 56 hours of “Top Balance” time to fix it. Since your solar array only keeps the battery at high voltage for maybe 45 minutes a day, the imbalance wins every time. You aren’t balancing; you’re just watching a “Weak Cell Cascade” in slow motion.
Q: Why does my inverter shut down when the BMS claims I still have 25% SOC?
A: You’re seeing Voltage Sag caused by rising Internal Resistance. As cells age or get cold, they can’t move ions fast enough. When a heavy load hits, the voltage “dips” instantly. The weakest cell hits the 2.8V floor, the BMS trips to prevent permanent damage, and you’re left with “Stranded Capacity.” The energy is technically there, but your battery is too “tired” to push it out.
Q: Is it really worth spending 2x the money on a battery just to "baby" it at 50% DoD?
A: It’s the only way to get a positive ROI. If you run a 10\kWh pack at 100% DoD, it might die after delivering 12,000\kWh of total energy. If you buy a 20\kWh pack and cycle it at 50% DoD, the reduced chemical stress means it can easily deliver 45\kWh+ over its life. You aren’t “wasting” 50% of the battery; you’re using it as a buffer to prevent the chemical “Damage Zones” that kill cells.
Q: I was told LFP is "indestructible" compared to NMC. Why the conservative settings?
A: LFP is chemically stable (it won’t catch fire), but it is electronically temperamental. Because the voltage curve is so flat, the “cliff” at the end of the discharge is sudden and brutal. One cell reversal below 2.0V can permanently kill a 150$ cell. “Conservative” settings are the only way to manage a chemistry that gives you almost no voltage warning before it fails.
I am Engr. Ubokobong Ekpenyong, a solar specialist and lithium battery systems engineer with over five years of hands-on experience designing, assembling, and commissioning off-grid solar and energy storage systems. My work focuses on lithium battery pack architecture, BMS configuration, and system reliability in off-grid and high-demand environments.
Contains information related to marketing campaigns of the user. These are shared with Google AdWords / Google Ads when the Google Ads and Google Analytics accounts are linked together.
90 days
__utma
ID used to identify users and sessions
2 years after last activity
__utmt
Used to monitor number of Google Analytics server requests
10 minutes
__utmb
Used to distinguish new sessions and visits. This cookie is set when the GA.js javascript library is loaded and there is no existing __utmb cookie. The cookie is updated every time data is sent to the Google Analytics server.
30 minutes after last activity
__utmc
Used only with old Urchin versions of Google Analytics and not with GA.js. Was used to distinguish between new sessions and visits at the end of a session.
End of session (browser)
__utmz
Contains information about the traffic source or campaign that directed user to the website. The cookie is set when the GA.js javascript is loaded and updated when data is sent to the Google Anaytics server
6 months after last activity
__utmv
Contains custom information set by the web developer via the _setCustomVar method in Google Analytics. This cookie is updated every time new data is sent to the Google Analytics server.
2 years after last activity
__utmx
Used to determine whether a user is included in an A / B or Multivariate test.
18 months
_ga
ID used to identify users
2 years
_gali
Used by Google Analytics to determine which links on a page are being clicked
30 seconds
_ga_
ID used to identify users
2 years
_gid
ID used to identify users for 24 hours after last activity
24 hours
_gat
Used to monitor number of Google Analytics server requests when using Google Tag Manager
1 minute
You can find more information in our Cookie Policy and .