Introduction
I’ve debugged a lot of battery systems that shouldn’t have failed. One call last year stands out: a solar installer in Montana with a brand-new 16S LiFePO4 pack, quality cells, reputable BMS. The system kept shutting down at what the monitoring showed as “50% state of charge.” Pack voltage read 52.8V when it died well above the 40V minimum the datasheet specified. The customer was furious. The installer was baffled. The BMS was doing exactly what it was programmed to do.
The problem wasn’t the BMS. It was that someone had configured the low-voltage cutoff at 2.5V per cell straight from the datasheet without accounting for the fact that real battery packs don’t behave like the single cells tested in climate-controlled labs.
This is an expensive and common mistake. I see it weekly: installers, system integrators, even experienced electrical engineers setting BMS parameters by copying numbers directly from cell specification sheets. It looks right on paper. The math checks out. Then the system goes live and batteries either shut down prematurely, never fully charge, or worse one cell gets driven outside its safe operating range while the BMS reports everything normal at the pack level.
The industry operates on a dangerous assumption, that datasheet specifications translate directly to BMS cutoff settings. They don’t. Datasheets describe ideal single-cell behavior under controlled conditions. Your system has 8, 16, or 48 cells in series, each with slight manufacturing variances, operating across temperature swings, aging at different rates, and being asked to deliver high currents that the datasheet’s 0.2C discharge test never anticipated.
In this post, I’m walking through the specific technical reasons why datasheet-based BMS settings fail in real solar storage systems. This isn’t about theory or what lithium-ion cells should do. It’s about observed failure modes, the mechanisms behind them, and what actually works when you’re responsible for a system that needs to run reliably for 10+ years.
If you’re an installer who’s dealt with mystery shutdowns, a battery builder trying to understand why your packs won’t balance, or a system owner wondering why your expensive battery bank underperforms, this matters. The gap between datasheet specifications and real-world BMS configuration costs the industry millions in warranty claims, service calls, and destroyed customer confidence. More importantly, it can create unsafe conditions when cells get pushed beyond their actual operating limits while the BMS remains unaware.
What I see fail most often isn’t cheap cells or poorly designed BMS hardware. It’s the configuration specifically, the voltage and current thresholds that determine when the system disconnects to protect the battery. These settings interact with cell imbalance, temperature coefficients, internal resistance, and charge controller behavior in ways that aren’t obvious until you’ve watched hundreds of systems operate across real environmental conditions.
We’ll cover the mechanisms. We’ll look at the math. And I’ll give you the practical margin values and configuration strategies that prevent these failures. But first, you need to understand what the datasheet is actually telling you and what it’s silently leaving out.
What the Datasheet Actually Tells You
When you open a lithium cell datasheet, you’re looking at laboratory test results under conditions that will never exist in your installation. This isn’t a criticism of cell manufacturers datasheets serve a specific purpose. But understanding what they measure and what they ignore is critical to avoiding the configuration mistakes I see repeatedly.
The Test Conditions Nobody Reads
Datasheets typically specify three voltage parameters: maximum charge voltage (often 3.65V for LiFePO4, 4.20V for NMC), minimum discharge voltage (2.5V for LFP, 2.75V for NMC), and a recommended operating range (usually 2.8-3.5V for LFP). These numbers come from cells tested individually at 25°C ±2°C, charged and discharged at 0.2C to 0.5C rates, with voltage measured after the cell has rested for 30-60 minutes to eliminate polarization effects.
In practice, none of these conditions match your solar installation. Your cells are in series 16 cells for a 48V nominal system which means the BMS sees pack voltage, not individual cell voltage in real-time unless you’ve invested in a cell-level monitoring system. Your ambient temperature swings from -10°C to 45°C depending on where the battery enclosure sits. Your charge current comes from solar panels with variable output, and your discharge current spikes to 2C or 3C when the inverter starts a well pump or air conditioner. And nobody waits an hour between charge and discharge to let voltage settle.
What's Explicitly Listed
The three critical specifications are maximum charge voltage, minimum discharge voltage, and continuous discharge current rating. Maximum charge voltage tells you the point where lithium plating risk becomes significant exceed this consistently and you’re damaging the anode, building dendrites, and reducing cycle life. For LiFePO4, this is typically 3.65V per cell. For NMC, it’s 4.20V. Some manufacturers specify 3.60V or 4.15V as recommended maximums with absolute limits 50-100mV higher.
Minimum discharge voltage indicates where the cell’s usable capacity effectively ends. Below this point, the voltage drops sharply, internal resistance increases dramatically, and you risk copper dissolution from the current collector. The datasheet might list 2.0V as an absolute minimum but recommend 2.5V for cycle life. What they don’t tell you is that this 2.5V figure assumes you’re discharging at a leisurely 0.2C rate and that the cell voltage has stabilized under load.
The continuous discharge current rating often expressed as 1C or 2C tells you what the cell can sustain thermally. But this is tested with forced air cooling or in a temperature-controlled chamber, and it assumes all cells in your pack are performing identically. A 280Ah cell rated for 1C continuous can theoretically supply 280A indefinitely at 25°C. At 45°C in a poorly ventilated battery box, with internal resistance that’s increased 30% after 500 cycles, that same cell might only sustain 200A before overheating.
What the datasheet doesn’t tell you
Here’s what the datasheet doesn’t tell you:
1. Cell-To-Cell Voltage Variance At Manufacturing
cell-to-cell voltage variance at manufacturing. Your 16 cells might arrive with a 30mV spread at 50% state of charge, or they might have a 150mV spread. Both are within typical manufacturing tolerances, but one creates manageable imbalance and the other creates immediate problems. The datasheet shows you one perfect cell. You’re installing 16 imperfect ones.
2. Temperature coefficients
Temperature coefficients are usually absent or buried in a footnote. LiFePO4 cells lose approximately 3-5mV per degree Celsius. A cell at 3.3V and 25°C drops to 3.15V at -5°C same state of charge, 150mV lower voltage just from temperature. If your BMS discharge cutoff is set to 2.5V per cell based on the datasheet, that becomes an effective 2.65V cutoff in cold weather, or you’re looking at 40-50% of your capacity becoming inaccessible when you need it most.
3. Aging Behavior
Aging behavior isn’t modeled. The datasheet might claim 3,000 cycles to 80% capacity, tested at 25°C with full charge/discharge cycles in controlled conditions. It doesn’t tell you that cells age at different rates depending on their position in the pack (the ones near the BMS board run hotter), or that capacity loss is non-linear (cells that started with 2% less capacity fade faster), or that internal resistance increases can double over the pack’s lifetime.
4. The Single-Cell vs. Series-String Gap
This is the fundamental disconnect: datasheets characterize individual cell performance. Your system depends on series string behavior. When you put 16 cells in series, you don’t get 16 times the voltage of a single cell operating under datasheet conditions. You get the voltage of 16 cells with manufacturing variance, operating at different temperatures, aging at different rates, with the weakest cell determining when the BMS trips.
A datasheet might show a beautiful discharge curve from 3.6V down to 2.5V with smooth, predictable voltage decline. Your 16S pack shows something messier: 15 cells tracking together and one lagging cell that hits 2.5V while the others still sit at 2.8V. The pack voltage reads 44.5V well above your calculated 40V cutoff (16 × 2.5V) but the BMS correctly trips on individual cell undervoltage. To someone looking at pack voltage, this appears to be a premature shutdown with 30-40% capacity remaining.
The datasheet is not wrong. It’s just incomplete for your application. It tells you what a single cell can do under ideal conditions. Your job is to configure the BMS for what a pack of real cells will do under actual operating conditions which means adding margins, accounting for imbalance, compensating for temperature, and planning for aging. Copying datasheet numbers directly into BMS settings ignores all of this, and that’s where the failures begin.
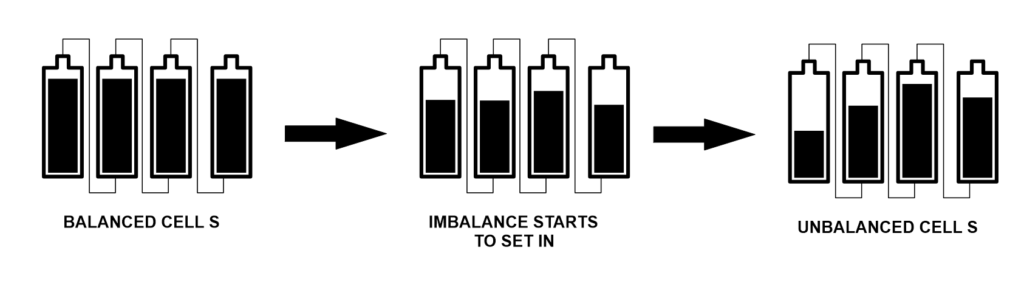
1. The Cell Imbalance Reality
The single most underestimated problem in lithium battery systems is cell imbalance, and it starts the day your cells arrive. I’ve measured brand-new cells fresh from the factory with voltage spreads ranging from 30mV to 180mV at 50% state of charge. Both batches came from reputable manufacturers with tight quality control. Both were sold as “matched” cells. The difference is that one batch is manageable and the other will cause problems within the first 50 cycles.
Manufacturing Variance Is Normal and Unavoidable
Cell manufacturing involves coating electrodes, winding or stacking them, filling with electrolyte, and formation cycling. Each step introduces small variations. One cell might have 0.5% more active material. Another might have slightly higher internal resistance from electrode alignment. A third might have fractionally different electrolyte volume. These variations are within specification a ±2% capacity tolerance is standard, meaning your “280Ah” cells might actually range from 274Ah to 286Ah.
What matters for series strings is that these capacity differences translate directly to voltage differences during charge and discharge. The 274Ah cell reaches 100% state of charge and its maximum voltage before the 286Ah cell. During discharge, it reaches 0% SOC and minimum voltage first. If your BMS cutoff is set to datasheet specifications without margin, that weakest cell triggers the disconnect while the strongest cells still have 8-12% usable capacity remaining.
In practice, I see this manifest as customers complaining about systems that never deliver the advertised capacity. They purchased a 14kWh pack and consistently get 11-12kWh of usable energy. The math is simple but brutal: in a 16S configuration, if one cell is 5% weaker than average, you lose that 5% from the entire pack’s usable capacity. The BMS protects that weak cell by shutting down early, and all the capacity in the stronger cells becomes stranded.
How Imbalance Compounds Over Time
Cell imbalance doesn’t stay static. It gets worse through a mechanism that’s almost elegant in its inevitability. The weak cell let’s say it’s Cell 7 in your 16S string reaches full charge first during every charge cycle. If you’re using a BMS with passive balancing (and most are), the BMS activates a bypass resistor across Cell 7, bleeding current at typically 35-60mA to prevent overvoltage while the other cells continue charging.
This looks good on paper, but here’s what actually happens: your solar charge controller is pushing 50A into the pack. Cell 7 needs to dissipate 50A worth of charge energy, but the balancing resistor can only shunt 50mA. The other 49.95A has nowhere to go, so the BMS terminates the charge cycle when Cell 7 hits the high-voltage cutoff let’s say 3.65V. At that moment, Cells 1-6 and 8-16 might still be at 3.50V, never reaching full charge.
Over repeated cycles, this creates a divergence problem. The weak cell cycles between 100% and ~20% SOC. The strong cells cycle between ~90% and ~20% SOC. Lithium cells that never reach full charge gradually lose capacity through incomplete lithium intercalation active material becomes electrochemically isolated. Meanwhile, the weak cell that’s constantly cycled to 100% SOC experiences accelerated calendar aging. Within 200-300 cycles, the capacity difference that started at 5% has grown to 8-10%.
I’ve measured this progression in failed packs. A 16S LiFePO4 system that started with 100mV imbalance will typically show 200-250mV imbalance after 18-24 months of daily cycling. The pack voltage still looks reasonable maybe 52.8V instead of 53.2V at full charge but individual cell inspection reveals Cell 7 at 3.65V, Cells 3, 9, and 14 at 3.45V, and the rest scattered between 3.48-3.52V. That 200mV spread means you’re losing 15-20% of the pack’s theoretical capacity to imbalance alone.
why Passive Balancing Can't Keep Up At 35-60mA bleed rate vs. charge current
Most BMS designs use passive balancing because it’s simple and cheap: a resistor and MOSFET across each cell, controlled by the BMS microcontroller. When a cell’s voltage exceeds the others by a threshold (typically 30-50mV), the BMS activates that cell’s bypass resistor. The resistor dissipates energy as heat, slowly bringing that cell’s voltage down while the others catch up.
The fundamental limitation is current capacity. A typical passive balancing circuit can shunt 35-60mA per cell. High-end BMS boards might do 100-200mA. Compare this to charge currents: a 5kW solar array charging a 48V battery delivers 100A. Even with perfect MPPT efficiency, you’re asking a 50mA bypass to compensate for 100A of charge imbalance. The math doesn’t work.
What I see in real systems is that passive balancing only functions effectively during the absorption phase the period when charge current has tapered from bulk charge (high current) down to 5-10A as the battery approaches full. This might last 30-90 minutes in a solar system, depending on how the charge controller is programmed. If your absorption voltage is set to the datasheet maximum (say, 58.4V for a 16S LFP pack, or 3.65V per cell), the BMS will hit high-voltage cutoff and terminate charging before balancing completes. The weak cell reaches 3.65V, the BMS opens the charge relay, and the strong cells never catch up.
The workaround that actually functions is to program a lower absorption voltage maybe 56.8V (3.55V per cell) and extend the absorption time to 2-4 hours. This keeps all cells in the voltage range where balancing occurs without triggering high-voltage cutoff, giving the bypass resistors time to equalize the cells. But this contradicts the datasheet’s recommended 3.65V maximum charge voltage, which is why installers following datasheet specs often end up with poorly balanced packs that never reach full capacity.
A Concrete Example of the Problem
Let’s work through the numbers for a 16S280Ah LiFePO4 pack with moderate imbalance. Cells 1-15 have 280Ah capacity. Cell 16 has 266Ah (5% less within manufacturing tolerance). Your BMS discharge cutoff is set to 2.5V per cell, straight from the datasheet, which specifies 40V minimum pack voltage (16 × 2.5V).
During discharge, all cells start at 3.4V (54.4V pack). At 50% state of charge, the pack voltage is around 52.0V and all cells read approximately 3.25V. At 80% depth of discharge, Cells 1-15 are at 3.05V and Cell 16 has dropped to 2.85V. Pack voltage is 49.6V still well above your 40V cutoff. But you’re only 20 minutes from Cell 16 hitting 2.5V while Cells 1-15 still have 15-18% capacity remaining.
When Cell 16 reaches 2.5V, pack voltage reads 44.5V. Your monitoring system shows the battery at “nominal 45V” and your calculations say you should have another 2-3kWh available before hitting the 40V safety cutoff. Instead, the BMS trips on individual cell undervoltage. The inverter shuts down. The customer calls to report that their battery died at “50% charge.”
They’re not wrong. From a pack voltage perspective, 44.5V on a 48V nominal system is roughly 50% state of charge. But from a cell-level perspective, Cell 16 is at 0% and the BMS is correctly protecting it from over-discharge. The usable capacity you calculated based on datasheet specs and pack voltage doesn’t exist because of imbalance.
This is why datasheet-based cutoff settings fail. They assume all cells are identical and will reach minimum voltage simultaneously. In real packs, one cell always hits the limit first, and the margin between datasheet minimum and safe operating minimum determines how much capacity you lose to imbalance. If you had set the discharge cutoff to 2.8V per cell (44.8V pack) instead of 2.5V (40V), you’d have the margin to handle this 5% capacity variance without premature shutdowns but you’d be operating “outside” the datasheet specification.
2. Temperature Destroys Datasheet Assumptions
I got a call from an installer in Wyoming last January. His customer’s battery system worked flawlessly through summer and fall, then started shutting down randomly once temperatures dropped below freezing. The monitoring showed 55-60% state of charge at shutdown. Pack voltage read 50-51V nowhere near the 44V low-voltage cutoff he’d programmed. He suspected a failing BMS. I asked him one question: “Where’s the battery mounted, and what’s the cell temperature?”
The battery box was in an unheated garage. Cell temperature was -8°C. That was the entire problem.
The Voltage-Temperature Coefficient Nobody Accounts For
Lithium cells have a negative temperature coefficient: voltage decreases as temperature drops, even at the same state of charge. For LiFePO4, this coefficient is approximately -3 to -5mV per degree Celsius per cell. For NMC chemistry, it’s slightly less pronounced at -2 to -3mV/°C. This isn’t a minor effect. It’s a fundamental shift in the cell’s open-circuit voltage that changes your effective operating range.
Here’s what this means in practice: a LiFePO4 cell at 3.30V and 25°C will measure approximately 3.20V at 0°C and 3.15V at -10°C. Same state of charge, same cell, 150mV voltage drop purely from temperature. Scale this to a 16S pack: that’s 2.4V difference at the pack level between room temperature and cold weather operation. Your 52.8V resting voltage at 25°C becomes 50.4V at -10°C with identical state of charge.
Now apply this to BMS cutoff settings. If you’ve programmed a 2.5V per cell discharge cutoff (40V pack minimum) based on the datasheet, you’re actually looking at an effective 2.65-2.75V cutoff in freezing conditions. A cell that would still have 20-25% usable capacity at 2.5V and 25°C hits your cutoff voltage at -10°C with 35-40% capacity remaining. The BMS sees 2.5V, interprets this as critically low, and disconnects. Pack voltage might read 44-46V, but temperature has shifted the voltage curve enough that you’re nowhere near actual cell depletion.
BMS Temperature Measurement Limitations
Most BMS boards measure temperature at one or two points: typically, the BMS PCB itself and maybe a thermistor mounted on the battery case or terminals. Very few systems measure individual cell temperatures, and even fewer measure internal cell temperature. This creates a significant blind spot.
What I observe in real installations is that BMS-reported temperature lags actual cell temperature by 15-30 minutes, depending on thermal mass and insulation. When ambient temperature drops suddenly say, from afternoon sun to a cold evening the BMS thermistor might read 15°C while cells are already at 5°C. The BMS applies no temperature compensation because it thinks conditions are still moderate. Meanwhile, cell voltage has already dropped 150-200mV from the temperature change, pushing you closer to cutoff thresholds without the BMS being aware.
Battery boxes mounted in direct sunlight show the opposite problem. I’ve measured 65°C case temperatures on black battery enclosures in summer sun, with BMS thermistors reporting 55°C because they’re mounted on shaded portions of the PCB. Cells near the center of the pack can be 5-10°C hotter than the case temperature. At these elevated temperatures, internal resistance increases 30-50%, capacity decreases by 5-10%, and voltage sag under load becomes significantly worse.
The practical result is that your BMS is making disconnect decisions based on incomplete temperature data. It sees voltage drop and assumes state of charge is declining, when actually the cells are just cold. Or it sees voltage that looks acceptable but doesn’t recognize that internal resistance has doubled from heat, and the next high-current load will cause a voltage collapse that triggers low-voltage cutoff.
Geographic and Seasonal Realities
Datasheet test conditions assume 25°C ±2°C. Your installation operates across whatever temperature range exists at the installation site. In Minnesota, that might be -20°C to +35°C. In Arizona, it’s 0°C to +55°C. In coastal California, you might actually stay close to 15-25°C year-round. The BMS configuration that works perfectly in San Diego fails catastrophically in Fargo.
I’ve seen solar installers use identical BMS settings across their entire service territory, from southern Nevada to northern Idaho. The Nevada systems run fine because temperature rarely drops below 5°C. The Idaho systems have chronic winter shutdowns because nobody compensated for the -15°C garage temperatures. Both installations used quality cells, proper BMS hardware, and followed manufacturer datasheets. The difference was environmental conditions that the datasheet never addressed.
Seasonal variation creates a particularly insidious problem: systems that work perfectly for 8-9 months, then fail during winter, then recover in spring. Customers lose confidence. They assume the battery is defective. Installers make unnecessary warranty claims. The root cause is simply that discharge cutoff was set to datasheet minimum without temperature margin, and cold weather operation requires 200-300mV additional headroom.
Cold Weather Capacity Loss Is Separate from Voltage Shift
Here’s where it gets more complex: temperature doesn’t just shift voltage; it also reduces actual available capacity. LiFePO4 cells lose approximately 10% of rated capacity at 0°C and 20-30% at -20°C compared to 25°C performance. This is a real electrochemical limitation lithium-ion mobility decreases at low temperature, internal resistance increases, and the usable voltage window narrows.
Also Read: Why 100% Maximum Usable Capacity is a Lithium Battery Death Sentence
What this means practically is that temperature hits you twice. First, voltage drops from the temperature coefficient, making your cutoff trigger earlier. Second, actual capacity decreases, so even if you compensate for voltage shift, you’re still getting less runtime. A 280Ah cell at 25°C might deliver 250Ah at 0°C, and only 200Ah at -20°C before hitting minimum safe voltage.
I’ve tested this directly on packs in climate chambers. A 16S280Ah system (14.3kWh nominal) delivers its full rated capacity at 20-25°C. At 0°C, usable capacity drops to 12.5-13kWh even with properly configured cutoffs. At -10°C, you’re looking at 11-11.5kWh. The customer who expected 14kWh of storage gets 80% of that in winter, and no amount of BMS tuning can recover the capacity that’s electrochemically unavailable at low temperature.
Hot Weather Accelerates Voltage Sag
High temperatures create different problems. Internal resistance increases with temperature above ~35°C, meaning voltage sag under load becomes more pronounced. A cell that might drop 200mV at 2C discharge and 25°C could drop 300-350mV at 45°C. If your discharge cutoff is set tight to datasheet minimums, high-temperature operation causes nuisance trips under heavy loads that would be fine in cooler conditions.
I’ve diagnosed systems in Texas and Arizona where air conditioner startup causes battery disconnects on hot afternoons but not during morning hours. Cell temperature at 2 PM might be 50°C from cumulative solar heating. The inverter draws 200A to start a compressor, voltage sags to 42V momentarily, and the BMS trips on undervoltage even though the battery has 70% charge remaining. Two hours later, after cells cool to 40°C, the same load starts without issue.
The datasheet doesn’t warn you about this because testing occurs at controlled 25°C. Real installations see thermal cycling from 15°C at night to 50°C in afternoon sun. Your BMS settings need to account for the worst-case temperature extreme, not the datasheet test condition, or you’ll have seasonal failures that appear random but are actually predictable thermal effects.
Practical Temperature Compensation
Some BMS boards offer temperature-compensated cutoffs: you program a base voltage threshold at 25°C and a compensation factor (mV per °C), and the BMS adjusts cutoff points based on measured temperature. This works well if the BMS actually measures cell temperature accurately. Most don’t. They measure board or case temperature, which lags and doesn’t represent internal cell conditions.
In practice, the most reliable approach is to set cutoffs conservatively enough to handle your worst-case temperature extremes without compensation. If your installation sees -10°C in winter, add 300mV to the datasheet discharge minimum per cell. If it sees +50°C in summer, add margin for increased internal resistance and voltage sag. This means you’re operating well away from datasheet limits during moderate conditions, but you have the headroom to function reliably when temperature extremes occur.
What doesn’t work is following datasheet specs and hoping temperature won’t matter. It matters enormously, and it’s the root cause of a huge percentage of the “mysterious” battery shutdowns I’m called to diagnose. The battery isn’t failing. The BMS isn’t defective. The system is just operating outside the narrow temperature window that the datasheet assumed, and nobody added the margins necessary for real-world conditions.
3. Voltage Sag and Internal Resistance
The most common disconnect complaint I investigate goes like this: “The battery was at 60% charge, the inverter tried to start, and everything shut down. Five minutes later, the battery voltage recovered and looked fine.” This isn’t a BMS malfunction or a failing battery. It’s voltage sag under load interacting with cutoff settings that were configured based on resting voltage specifications from the datasheet.
Internal Resistance Is Not a Datasheet Specification
Most lithium cell datasheets either don’t list internal resistance or bury it in a footnote with a measurement taken at 50% SOC, 25°C, at 1kHz AC impedance. That number often 0.5-1.5 milliohms for large-format LiFePO4 cells is technically accurate but operationally useless. What matters for BMS configuration is DC internal resistance under actual load conditions, and that changes dramatically with state of charge, temperature, age, and discharge rate.
A new 280Ah LiFePO4 cell might measure 0.8mΩ internal resistance at 50% SOC and 25°C. At 20% SOC, that same cell measures 1.5-2.0mΩ. At 0°C, it’s 2.5-3.0mΩ. After 1,000 cycles, it’s 1.2-1.5mΩ even at optimal conditions. At 10% SOC, 0°C, after 1,000 cycles, you’re looking at 4-5mΩ. That’s a 5-6x increase in internal resistance compared to the datasheet figure, and every milliohm of resistance translates directly to voltage drop under load.
For a 16S pack, internal resistance adds up. Sixteen cells at 1.0mΩ each gives you 16mΩ pack resistance in ideal conditions. In cold weather, aged cells, at low state of charge, that becomes 60-80mΩ. Now apply real load current: a 5kW inverter pulling from a 48V battery draws approximately 105A continuous (accounting for inverter efficiency). At 16mΩ, that’s a 1.68V voltage drop. At 70mΩ, it’s 7.35V.
This is why systems shut down with apparent charge remaining. The battery might rest at 50V, but under 100A load it sags to 43V or 42V. If your discharge cutoff is programmed to 44V based on the datasheet’s 2.75V per cell minimum (16 × 2.75V = 44V), you’re hitting cutoff under load despite having 30-40% usable capacity. The voltage recovers within seconds after load removal, which makes the shutdown appear random or intermittent to anyone looking at resting voltage.
Load Voltage vs. Resting Voltage
The datasheet specifies minimum discharge voltage measured after load removal, typically with a 30–60-minute rest period. This is open-circuit voltage what the cell measures when no current is flowing and polarization has relaxed. Your BMS measures voltage under load, and those two numbers can differ by 0.3-0.8V per cell depending on discharge rate and internal resistance.
In practice, I see voltage sag of 4-8V at the pack level during high-current discharge. A 48V nominal pack (16S LiFePO4) might rest at 51V at 40% state of charge. Apply a 150A load for inverter surge current air conditioner compressor start, well pump, any motor load and voltage instantly drop to 45-47V. Hold that load for 10-15 seconds and voltage sags further to 43-44V as internal temperature rises and resistance increases. Release the load and voltage recovers to 50V within 30 seconds.
If your discharge cutoff is set to 44V pack voltage, the BMS sees that momentary sag to 43V and trips the disconnect relay. From the BMS perspective, this is correct operation it detected undervoltage and protected the cells. From the user’s perspective, the battery died with plenty of charge remaining. The monitoring system shows 50V now that load has been removed, confirming that the shutdown appeared premature.
The worse the internal resistance, the worse this problem becomes. New cells with low IR might sag 3-4V under heavy load. Cells that have aged 1,500 cycles with IR that’s doubled might sag 6-8V under the same load. As your battery ages, loads that worked fine initially start causing shutdowns, and customers assume the battery is failing when actually the BMS cutoff settings just don’t have enough margin for the increased IR.
Inverter Behavior Amplifies the Problem
Modern inverters don’t draw constant current. They draw pulsing current at high frequency, with peak currents during each pulse that can be 2-3x the average current draw. A 5kW inverter might show 105A average on your battery monitor but actually pull 200-250A peak current during each switching cycle. Those peak currents cause voltage spikes downward that are worse than the average current would suggest.
Additionally, inverter startup surge can be brutal. Many inverters draw 2-3x rated current for 1-2 seconds during initialization or when starting motor loads. Your battery might handle 100A continuous without issue, but the 200A startup surge causes enough voltage sag to trigger low-voltage cutoff. The inverter never fully starts, the battery disconnects, voltage recovers, the inverter tries again, and you get an oscillation where the system can’t stabilize.
I’ve measured this on installations where the customer reports that certain loads “never work” while others are fine. The loads that don’t work are the ones with high startup current—air conditioners, well pumps, table saws. The loads that work fine have soft-start or low inrush current. The battery has sufficient capacity, but the voltage sag during inrush exceeds the BMS cutoff threshold. Adding 1-2V margin to the discharge cutoff eliminates the problem without any other system changes.
The Oscillation Death Spiral
Here’s the failure mode that destroys customer confidence: voltage sag causes BMS disconnect, voltage recovers immediately, BMS reconnects, inverter tries to start, voltage sags again, BMS disconnects. This can cycle 5-10 times before the BMS or inverter gives up and latches into a fault state. To the customer, it looks like the system is broken. To the installer, diagnostics show normal voltage and capacity. The issue is that cutoff and reconnect voltages are too close together without adequate hysteresis.
Proper BMS configuration requires hysteresis a voltage difference between disconnect and reconnect thresholds. If discharge cutoff is 44V, reconnect should be 48V or higher. This prevents the oscillation: once the BMS disconnects, voltage must recover significantly before it re-enables, giving the system time to stabilize. But if you’ve set cutoff at the datasheet minimum (40V) and reconnect 1-2V higher (42V), you don’t have enough hysteresis margin to prevent cycling, especially when IR-induced voltage sag is 6-8V under load.
What I see on failed installations is cutoff set to datasheet spec with minimal hysteresis because the installer wanted to maximize usable capacity. The system works initially with new cells and low IR. After 500-800 cycles, IR has increased 30-40%, voltage sag is worse, and the system starts oscillating under load. The installer returns to site, measures resting voltage (looks fine), checks capacity (still good), and can’t identify the problem because they’re not looking at voltage under load or considering IR increase over time.
State of Charge Makes It Worse
Internal resistance increases sharply below 30% SOC for most lithium chemistries. A LiFePO4 cell at 50% SOC might have 0.9mΩ IR. At 20% SOC, it’s 1.5mΩ. At 10% SOC, it’s 2.5-3.0mΩ. This means voltage sag gets progressively worse as you discharge deeper, creating a nonlinear effect where the last 20% of capacity is almost unusable under high current loads.
In practice, this manifests as systems that work fine down to 40-50% SOC but become unstable below that point. The customer can run their loads normally in the afternoon, but by evening when the battery is at 30% SOC, the same loads trip the BMS. They’re not drawing more current internal resistance has just increased enough that voltage sag now exceeds cutoff threshold.
If you set discharge cutoff based on datasheet minimum voltage, you’re assuming internal resistance stays constant across the entire SOC range. It doesn’t. The datasheet might show a smooth discharge curve from 3.4V down to 2.5V, but that curve was measured at 0.2C discharge rate. At 2C discharge rate which is routine in solar-plus-storage systems the curve drops sharply below 30% SOC because rising IR causes exponentially worse voltage sag.
Practical Cutoff Settings for Real IR
The correction is to set discharge cutoff 0.3-0.5V per cell higher than datasheet minimum, specifically to create margin for IR-induced voltage sag. For a 16S LiFePO4 pack, instead of 40V (2.5V per cell from datasheet), configure 44-46V (2.75-2.875V per cell). This looks conservative you’re “losing” 10-15% of theoretical capacity. In reality, you’re preventing nuisance trips and actually delivering more usable capacity because the system doesn’t shut down prematurely under load.
The margin needs to scale with worst-case IR conditions: low SOC, cold temperature, aged cells. If your installation sees -10°C operation, add more margin. If cells are expected to reach 2,000+ cycles, add margin for future IR increase. If loads routinely pull 1.5-2C discharge rates, add margin for high-current sag.
What doesn’t work is setting cutoff tight to datasheet specs and hoping IR won’t matter. It matters enormously. It’s the difference between a system that delivers rated capacity under real loads versus one that shuts down with 30% charge showing on the monitor. Voltage sag isn’t a failure it’s physics. Your BMS configuration needs to account for it, and the datasheet gives you zero guidance on how much margin is actually required for reliable operation.
4. The Absorption Phase Problem
I’ve lost count of how many times I’ve opened a battery monitoring app, looked at cell voltages, and seen something like this: 3.65V, 3.52V, 3.49V, 3.51V, 3.48V, 3.50V, 3.65V, 3.53V, 3.49V, 3.51V, 3.65V, 3.50V, 3.52V, 3.48V, 3.50V, 3.49V. Three cells pegged at maximum charge voltage while the other thirteen sit 100-150mV lower. The pack never balances. The customer never gets full capacity. And it all traces back to absorption phase configuration that followed datasheet voltage specs without understanding how balancing actually works.
Balancing Only Happens in a Narrow Window
Passive balancing which is what 95% of BMS boards use only functions when cells are in the top portion of their voltage curve, typically between 3.50V and 3.65V for LiFePO4. Below 3.50V, cell voltages are too tightly grouped for the BMS to detect meaningful imbalance. The BMS might have a 30mV differential threshold: it only activates balancing when a cell exceeds others by that amount. At 3.30V average, cells might vary by only 10-20mV, so balancing never triggers.
This means balancing is almost entirely dependent on what happens during absorption the phase after bulk charge when current tapers and voltage approaches maximum. In a solar system, bulk charge runs at maximum available current (could be 50-100A from the array) until pack voltage reaches absorption setpoint (typically 57.6V or 3.6V per cell for LFP). Then the charge controller holds that voltage while current gradually decreases. As current drops below 10-20A, cells enter the voltage range where balancing can occur.
Here’s the critical problem: if your absorption voltage is set to datasheet maximum (3.65V per cell, 58.4V pack), the fastest-charging cell the one with slightly less capacity or slightly lower internal resistance reaches 3.65V while the pack is still in bulk charge at high current. The BMS sees individual cell overvoltage and has two choices: either open the charge disconnect relay (terminating the charge cycle), or activate balancing on that cell while continuing to charge the others.
Most BMS boards will trigger high-voltage cutoff and terminate charging. The charger shuts off, bulk charge never transitions to absorption, and balancing never occurs. The weak cell got to 3.65V, the strong cells stopped at 3.50-3.55V, and imbalance just got locked in for another cycle. Repeat this 50-100 times and you have packs where three or four cells are always at maximum voltage while the rest never catch up.
The Runner Cell Phenomenon
I call them runner cells the ones that race ahead during charging and hit maximum voltage first. They’re typically cells with 2-5% less capacity than pack average, or cells with slightly lower internal resistance that charge faster under the same current. Every pack has at least one. Well-matched packs might have runner cells that are only 10-15mV ahead. Poorly matched packs can have runner cells 100-150mV ahead of the pack average.
Runner cells determine when charging stops if absorption voltage is set to datasheet maximum. The pack might have 12kWh stored and theoretical capacity of 14kWh, but when that runner cell hits 3.65V, charging terminates. You’ve lost 2kWh of capacity 14% of the pack because one cell reached maximum voltage before the others finished charging.
The compounding problem is that runner cells get worse over time. That cell is cycling to 100% SOC every charge while the others cycle to 90-95% SOC. Lithium cells that consistently reach 100% SOC experience faster calendar aging increased SEI layer growth, lithium inventory loss, impedance rise. After 500 cycles, that runner cell might have lost 5% more capacity than the pack average. Now it’s even more of a runner cell, hitting max voltage even earlier, preventing the pack from charging even longer, and the gap widens.
Absorption Time Matters More Than Voltage
The fix that actually works is counterintuitive: lower the absorption voltage and extend the absorption time. Instead of 58.4V (3.65V per cell) for 30 minutes, program 56.8-57.6V (3.55-3.6V per cell) for 2-4 hours. This keeps all cells in the balancing-active voltage range without triggering high-voltage cutoff on runner cells, giving passive balancing time to equalize the pack.
At 3.55V per cell, even runner cells won’t hit the 3.65V overvoltage threshold. The BMS keeps charging enabled. Current tapers to 5-10A as cells approach full charge. Balancing activates on cells that are 30-50mV higher than average, bleeding current at 35-60mA while the others continue accepting charge. Over 2-3 hours, this 35-60mA differential current is enough to equalize cells that started 50-100mV apart.
I’ve measured this on actual installations. A pack that shows 3.65V, 3.52V, 3.49V… at the end of a normal charge cycle will show 3.58V, 3.57V, 3.56V… after a 3-hour absorption at 3.58V per cell. The pack isn’t charged to absolute maximum cells are at 95-98% SOC instead of 100% but usable capacity actually increases because all cells are now equally charged instead of having runner cells at 100% and laggards at 85%.
Solar Charge Controllers vs. AC Chargers
This is where solar systems differ from AC-powered charging. An AC charger can be programmed for precise absorption profiles: constant voltage for defined time periods, with current tapering naturally as cells fill. Solar charge controllers are at the mercy of available sunlight. If a cloud passes over at 2 PM, charge current drops, absorption might end prematurely, and balancing doesn’t complete.
What I see in solar installations is that absorption phase is highly variable. On a clear day in June, you might get 4-5 hours of absorption as the sun tracks across the sky and slowly declines. On a partly cloudy day in December, you might get 20 minutes of absorption before the sun drops below the horizon or cloud cover reduces panel output. If your BMS relies on absorption for balancing and it does inconsistent absorption means inconsistent balancing.
The practical workaround is to program absorption voltage conservatively (3.55-3.58V per cell) so that even short absorption periods contribute to balancing, and to program absorption time long enough (3-4 hours) that the charge controller will hold absorption voltage even as current drops very low. Some charge controllers terminate absorption when current drops below a threshold (say, 2% of battery capacity). Disable that feature or set the threshold extremely low (0.5% or less) so absorption continues even at minimal current.
The Cumulative Imbalance Cycle
Here’s what happens when absorption is incorrectly configured: Day 1, the pack charges to 58.4V, runner cell hits 3.65V, charging stops, cells are imbalanced by 100mV. Day 2, the same thing happens. Day 3, same. By Day 30, imbalance has grown to 120mV because cells never equalized and differential aging is accelerating the problem. By Day 90, imbalance is 150-180mV, and you’re losing 15-20% of capacity to the gap between the weakest and strongest cells.
I’ve diagnosed packs that were less than six months old showing 200mV+ imbalance despite having quality cells and functional BMS. The root cause in every case was absorption voltage set to datasheet maximum (3.65V) with insufficient absorption time. The BMS was never given the conditions it needed to balance cells, so imbalance compounded until the pack was delivering significantly less than rated capacity.
The correction requires two changes: lower absorption voltage to 3.55-3.58V per cell, and extend absorption time to 3-4 hours minimum. Then wait 20-30 full charge cycles for the pack to gradually equalize. You can’t fix months of cumulative imbalance in a single charge cycle passive balancing at 50mA takes time to move capacity between cells. But over 3-4 weeks of proper absorption cycling, a pack that was 200mV imbalanced can recover to 30-50mV imbalance, and usable capacity increases by 10-15% without any hardware changes.
Why Datasheets Lead You Wrong
The datasheet specifies 3.65V maximum charge voltage for good reasons: that’s the voltage where lithium plating risk becomes significant, where SEI growth accelerates, where safety margins start to narrow. The datasheet is protecting cell longevity and safety. What the datasheet doesn’t tell you is that 3.65V as an absorption target prevents balancing in real multi-cell packs, and that charging to 3.55-3.58V with longer absorption time delivers better practical results.
Manufacturers test single cells. They charge to 3.65V, verify capacity, measure cycle life, and publish the data. They’re not testing 16S packs with passive balancing BMSs and solar charge controllers with variable absorption time. The gap between single-cell testing and multi-cell system behavior is where these failures occur, and the datasheet gives you no guidance on how to bridge that gap.
In practice, the most reliable LiFePO4 systems I see are charged to 3.55-3.60V per cell with 2-4 hour absorption holds, not the 3.65V maximum that datasheets specify. They sacrifice 2-3% of absolute maximum capacity in exchange for consistent balancing, even cell utilization, and longer service life. The customers get more usable capacity because all cells contribute equally, and the packs last longer because you’re not cycling runner cells to 100% SOC daily while laggard cells sit at 85-90%.
This is the absorption phase paradox: following datasheet voltage maximums gives you less usable capacity than operating slightly below them. The difference is whether your BMS can actually balance the pack, and that requires absorption configuration based on balancing requirements, not cell voltage limits.
5. Self-Discharge and Standby Current
A customer called me about a battery that had been sitting unused for three weeks while they were on vacation. They returned home, turned on the system, and the BMS immediately tripped on low-voltage cutoff. Pack voltage showed 51.2V right in the middle of the normal operating range. Individual cell inspection revealed the problem: fifteen cells at 3.25-3.28V, and Cell 9 at 2.45V. The pack hadn’t been discharged. It had been sitting idle. But one cell had self-discharged below the BMS cutoff threshold while the others remained stable.
BMS Monitoring Draws Constant Current
Every BMS with cell-level monitoring draws standby current. The microcontroller needs power. The voltage sensing circuits need power. The cell balancing MOSFETs have gate leakage. The communication interfaces CAN bus, RS485, Bluetooth draw power. This current has to come from somewhere, and it comes from the battery cells themselves.
Typical BMS standby current is 20-80mA for the entire board, but it’s not drawn equally from all cells. The BMS is powered from the full pack voltage, but voltage sensing happens at the cell level through resistor dividers or dedicated monitoring ICs. Each cell monitoring channel has leakage current typically 0.5-2mA per cell depending on the BMS design and component quality. This doesn’t sound like much, but it’s continuous and unequal.
In a 16S pack, you might have Cell 1 supplying 1.8mA to its monitoring channel, Cell 2 supplying 1.2mA, Cell 3 supplying 2.1mA, and so on. The variance comes from component tolerances in the voltage divider resistors and differences in the monitoring IC input impedance. Over 24 hours, that’s 43mAh, 29mAh, and 50mAh respectively. Over three weeks of storage, Cell 3 has lost 1,050mAh (1.05Ah) while Cell 2 has only lost 609mAh.
For a 280Ah cell, this seems trivial 0.4% capacity difference over three weeks. But remember that cells already have manufacturing variance and imbalance from previous cycling. If Cell 3 was already the weak cell in the pack, sitting 50mV lower than average, this additional 440mAh differential pushes it further out of balance. After three weeks, it might be 100-120mV lower than pack average. After three months of storage, it could be 200-250mV lower, approaching the BMS low-voltage cutoff while the rest of the pack is still at 50% state of charge.
Also Read: Why Most Solar-Battery Systems Fail Before Year 2
Cells Self-Discharge at Different Rates
BMS leakage is predictable and constant. Cell self-discharge is neither. Lithium cells self-discharge through internal chemical reactions SEI layer growth, electrolyte decomposition, parasitic side reactions. The rate varies with temperature, state of charge, cell age, and manufacturing quality. A typical LiFePO4 cell might self-discharge at 1-3% per month at 25°C. At 40°C, that could be 3-5% per month. At 0°C, it might drop to 0.5-1% per month.
More importantly, self-discharge rate varies cell to cell. In a batch of 16 cells, you might have 14 cells self-discharging at 1.5% per month and 2 cells self-discharging at 3% per month. This isn’t defective cells it’s normal manufacturing variance. Over six months of storage, those two cells lose 18% capacity while the others lose 9%. That 9% differential is 25Ah in a 280Ah cell, or roughly 80Wh at nominal voltage.
The cells with higher self-discharge are usually the same cells that already have slightly higher internal resistance or slightly lower capacity the runner cells from charging, the weak cells that hit discharge cutoff first. Self-discharge during storage makes existing imbalance worse, creating a compounding effect where the weakest cells get progressively weaker during idle periods.
Long Standby Creates Voltage Drift
I see this most often in seasonal systems vacation homes, RVs, boats where batteries sit unused for weeks or months at a time. The system was balanced and working perfectly when it was shut down. Three months later, the owner returns, powers up the system, and gets immediate BMS faults or drastically reduced runtime.
What happened is voltage drift during storage. Let’s say the pack was left at 60% state of charge approximately 3.30V per cell, 52.8V pack. Over three months, combined BMS leakage and self-discharge cause cells to drift apart. Cells with low self-discharge and low BMS leakage might drop to 3.22V (still 58% SOC). Cells with high self-discharge and high BMS leakage drop to 3.05V (45% SOC). The pack voltage has sagged to 50.4V, which looks acceptable, but individual cells now span a 170mV range.
When the owner tries to use the battery, the weak cells hit discharge cutoff almost immediately under load. The BMS reports 55% charge remaining based on pack voltage, but the weakest cell is at 40% SOC and drops below cutoff threshold within minutes of starting a moderate load. The system appears to have lost capacity during storage, but really it’s just imbalanced, and the imbalance is entirely from self-discharge and standby current that acted unequally on cells that were already slightly mismatched.
Float Voltage Matters More Than You Think
For systems that remain connected to charging sources during standby grid-tied systems, solar installations with continuous trickle charge float voltage determines whether standby current causes problems. Float voltage is the maintenance voltage that charge controllers apply after absorption completes, intended to compensate for self-discharge without overcharging.
Most solar charge controllers’ default to float voltages that are too high for lithium batteries. A typical setting might be 54.4V (3.4V per cell) for a 48V LiFePO4 system. This is fine for lead-acid but problematic for lithium. At 3.4V, cells are at roughly 70-80% state of charge, and the charge controller is actively pushing current to maintain that voltage. If cells have even slight imbalance, the charge controller keeps pushing the higher cells toward overcharge while trying to lift the lower cells to the setpoint.
What I observe is that high float voltage with imbalanced cells creates continuous balancing activity. The BMS is constantly bleeding current from high cells while the charge controller supplies current. This works, technically, but it’s thermally stressful (balancing resistors dissipating heat 24/7) and it masks underlying imbalance that should be corrected through proper absorption cycling.
Lower float voltage 13.2-13.5V (3.3-3.37V per cell) eliminates this problem. At 3.3V, cells are at roughly 30-40% SOC, charge current is minimal, and balancing isn’t required. Self-discharge and BMS leakage cause cells to drift very slowly, and occasional absorption charges (once every 2-4 weeks) re-equalize the pack. This is how you get systems that sit idle for weeks without developing imbalance or reaching cutoff thresholds.
Storage Mode and BMS Disconnect
Some BMS boards have a storage mode or sleep mode that reduces standby current dramatically down to 1-5mA total instead of 50-80mA. This helps, but it typically requires disconnecting the battery from loads and chargers, which means the BMS can’t monitor cell voltages or protect against imbalance during storage. You’re trading active monitoring for reduced self-discharge.
For long-term storage anything beyond 4-6 weeks I generally recommend physically disconnecting the BMS (pulling the main power connector or removing the service switch) and storing cells at 3.30-3.35V per cell (roughly 50-60% SOC). At this voltage, self-discharge is minimized, lithium plating risk is zero, and cells are in the middle of their safe storage range. When the system is recommissioned, cells will have drifted apart by 50-100mV, but a single equalization charge brings them back into balance.
What doesn’t work is leaving the BMS connected and expecting cells to remain balanced over months of storage. The BMS leakage alone even without considering cell self-discharge will create 100-200mV imbalance over 8-12 weeks. If the weak cell starts at 3.30V and drifts down to 3.10V while strong cells only drop to 3.22V, you’re approaching the low-voltage cutoff threshold (typically 2.8-3.0V with proper margins) without any actual discharge occurring.
The Hidden Cost of Always-On Monitoring
Modern systems want continuous monitoring smartphone apps showing real-time voltage, SOC estimates, historical data. This requires the BMS to be constantly powered, which means constant standby current draw. It’s convenient, but it creates the voltage drift problem during periods of light use or no use.
I’ve seen systems where customers check their battery app daily even though they’re only cycling the battery 2-3 times per week. The BMS is awake 24/7 for monitoring, drawing 60mA continuously. Over a week, that’s 10Ah of self-discharge just from monitoring 3.6% of a 280Ah cell’s capacity distributed unevenly across cells based on monitoring channel leakage. The customer is paying for continuous monitoring with reduced standby time and accelerated cell imbalance.
The practical middle ground is to use BMS boards that have efficient sleep modes with periodic wake-up for monitoring. The BMS sleeps at 2-5mA draw, wakes every 10-30 minutes to sample cell voltages and update SOC, then returns to sleep. Average current draw drops to 10-15mA, reducing standby losses by 75% while maintaining monitoring capability. Most modern BMS boards support this, but it’s often disabled by default because customers want instant app response, not 10-minute update delays.
Why Datasheets Ignore This Completely
Cell datasheets don’t address system-level standby current because they’re testing individual cells, not packs with BMS boards. They might specify self-discharge rate typically 1-3% per month but that’s measured on cells without monitoring circuits attached. Your real system has 0.5-2mA per cell of BMS leakage added on top of natural self-discharge, and that additional leakage is unequal from cell to cell.
The result is that systems designed strictly to datasheet specs often fail in standby or storage scenarios. The discharge cutoff was set to 2.5V per cell based on datasheet minimum. The system sits unused for six weeks. BMS leakage and self-discharge cause the weak cell to drift from 3.30V to 2.95V while the pack voltage only drops from 52.8V to 51.2V. The owner returns, attempts to use the system, and the weak cell immediately hits 2.5V cutoff under the first moderate load.
This isn’t battery failure. It’s predictable voltage drift during storage that wasn’t accounted for in BMS configuration. The fix is either to add 0.2-0.3V margin to discharge cutoff specifically for standby drift, or to implement storage protocols (disconnect BMS, periodic equalization charges) that prevent drift from accumulating. The datasheet gives you no guidance on any of this because standby behavior isn’t part of single-cell testing.
6. High-Current Discharge Realities
I was troubleshooting a system in rural Colorado where the customer’s well pump wouldn’t run. The battery monitor showed 65% state of charge. Pack voltage was 51.8V at rest. The inverter would start, the pump motor would begin to spin, and 800 milliseconds later the entire system would shut down. The customer had already replaced the inverter once under warranty. The problem wasn’t the inverter. It was that nobody had configured the BMS for the actual discharge current profile of a 2HP submersible pump.
Instantaneous Voltage Drop Is Brutal at High C-Rates
Datasheets typically show discharge curves at 0.2C, maybe 0.5C for high-power cells, occasionally 1C. A 280Ah cell at 0.2C is discharging at 56A. Real solar-plus-storage systems routinely pull 1.5-2C during inverter startup and heavy loads 420-560A from a 280Ah cell, or 420-560A from a 16S pack if the cells are that capacity. That’s an order of magnitude higher than datasheet test conditions.
At these discharge rates, voltage drop is no longer linear with current. Internal resistance increases with current density due to electrolyte depletion near electrodes, concentration polarization, and ohmic heating. A cell that drops 0.15V at 0.5C might drop 0.6V at 2C. The relationship isn’t 4x (double the current, double the voltage drop) it’s worse, more like 4-5x because internal resistance itself increases with discharge rate.
For a 16S pack pulling 200A continuous for a pump startup, you might see 8-10V total voltage drop from resting voltage to loaded voltage. A pack resting at 51V drops to 41-43V under that load. If your discharge cutoff is set to 44V based on datasheet minimums (2.75V per cell), the BMS sees 42V, interprets this as critical undervoltage, and opens the disconnect relay. The pump never gets the 3-5 seconds it needs to reach full speed. The inverter shuts down on input undervoltage. Voltage recovers to 51V within 10 seconds, and the customer is left staring at a battery that appears fully charged but won’t run their loads.
Voltage Recovery After Load Removal
Here’s what makes this particularly frustrating to diagnose: voltage recovers almost immediately after load removal. The Montana system I mentioned in the introduction the one that shut down at “50% charge” read 52.8V pack voltage when I arrived on site. I pulled the logs and saw it had been 45V under load before shutdown. The customer saw 52.8V and assumed the BMS malfunctioned. The BMS saw 45V approach the 44V cutoff and correctly protected the cells.
This voltage recovery happens because the mechanisms causing voltage drop electrolyte depletion, concentration gradients, resistive heating reverse within seconds to minutes after current stops flowing. Electrolyte diffuses back to electrode surfaces. Temperature drops slightly. Polarization relaxes. Within 30 seconds, voltage has recovered 80-90% of the way back to open-circuit voltage. Within 5 minutes, it’s fully recovered.
What this means practically is that transient undervoltage events look like intermittent faults. The system shuts down, voltage immediately looks normal, and diagnostics show no problems. The installer measures resting voltage (fine), checks cell balance (acceptable), tests capacity with a low-current load (works perfectly), and concludes the BMS is oversensitive. But the BMS isn’t wrong it’s responding to real undervoltage that occurs under high-current loads and disappears under no-load or low-current conditions.
C-Rate Impact on Effective Cutoff Voltage
The datasheet specifies minimum discharge voltage at a specific C-rate usually 0.2C for capacity testing. At higher C-rates, the effective minimum voltage increases because of IR-induced voltage drop. A LiFePO4 cell might safely discharge to 2.5V at 0.2C, but discharging to 2.5V at 2C means the cell’s actual open-circuit voltage is closer to 2.0V once you account for the 0.5V of IR drop. You’ve over-discharged the cell even though measured voltage under load was within spec.
This is why high-current discharge requires higher cutoff voltages. At 2C discharge, a safe cutoff might be 2.8-3.0V per cell to ensure that open-circuit voltage remains above 2.5V. At 1C, you might use 2.7-2.8V. At 0.5C, 2.6V might be adequate. The cutoff needs to scale with maximum expected discharge current, not just follow the single datasheet value that assumes low-rate discharge.
In practice, I calculate cutoff voltage by taking the datasheet minimum (2.5V for LFP), adding worst-case IR voltage drop for maximum load current (0.3-0.5V), and adding margin for temperature and aging (0.2V). This typically results in 3.0-3.2V per cell discharge cutoff for systems with high-current loads, versus the 2.5V that comes straight from the datasheet. It looks overly conservative until you measure actual voltage under load and realize you’re just compensating for physics.
Time-Based vs. Instantaneous Cutoff Logic
Better BMS designs implement time-delay logic for undervoltage cutoff: the voltage must remain below threshold for a specified duration (typically 3-10 seconds) before disconnect occurs. This prevents nuisance trips from momentary voltage sags during startup transients while still protecting against sustained overdischarge.
The well pump system in Colorado needed exactly this. Pump startup drew 200A for 2-3 seconds, during which voltage sagged to 42V. After the motor reached operating speed, current dropped to 80A and voltage recovered to 48V. An instantaneous 44V cutoff triggered during the startup transient. A 5-second delayed cutoff would have allowed startup to complete, after which operating voltage was well above cutoff threshold.
Most BMS boards have configurable delay, but it’s often set to zero or 1 second by default. Installers don’t adjust it because datasheets don’t mention it they just specify minimum voltage, not the time domain characteristics of how that voltage should be evaluated. I routinely configure 3-5 second delays on discharge cutoff for systems with motor loads, and 10-15 second delays for systems with known high-transient loads like air conditioners or power tools.
The risk with excessive delay is that you might allow a cell to sustain undervoltage for too long during genuine overdischarge events. The balance is to use enough delay to ignore startup transients (which last 1-3 seconds) but not so much delay that you fail to protect cells during a sustained high-current discharge that’s genuinely depleting the battery. Three to five seconds is typically the sweet spot long enough for inrush to settle, short enough to catch real problems within a few seconds.
Inverter Surge Current at Startup
Modern inverters are much better than older designs, but they still draw 2-3x rated current for 0.5-2 seconds during initialization. The input capacitors need to charge, the control circuitry needs to stabilize, and initial switching cycles can be inefficient until feedback loops settle. A 5kW inverter rated for 105A continuous might draw 250-300A for the first second of operation.
This surge happens every time the inverter starts either from a cold start or after a shutdown/restart cycle. If your BMS has tripped on transient undervoltage and then re-enabled after voltage recovered, the inverter attempts to restart, surge current causes another voltage sag, and you get the oscillation failure mode I described in Section 5. The system can’t stabilize because every restart attempt triggers another shutdown.
The correction requires both adequate cutoff margin and proper hysteresis. Cutoff voltage needs to be low enough that inverter surge doesn’t trigger it typically 42-44V for a 48V system with a quality inverter. Reconnect voltage needs to be high enough that the battery has genuinely recovered and can sustain the surge typically 48-50V. This 4-6V hysteresis gap prevents rapid cycling and gives the battery time to stabilize before allowing another connection attempt.
What I see on failed installations is 44V cutoff with 45V reconnect only 1V hysteresis. The pack sags to 42V during inverter surge, triggering cutoff. Voltage recovers to 48V in 20 seconds. BMS reconnects at 45V. Inverter tries to restart, surge current causes sag to 42V again, immediate cutoff again. This cycles until the inverter gives up and latches a fault, or until the BMS counts excessive reconnect attempts and locks out permanently.
Battery Protect Relays and Contact Welding
High-current disconnect creates another problem that datasheets never address: relay contact wear and welding. Most BMS boards use electromechanical relays for the charge and discharge disconnect common ratings are 100A, 200A, or 300A continuous. These relays are rated for continuous current, not for breaking current under load.
When the BMS opens a relay that’s conducting 150A, an arc forms between the contacts as they separate. If the relay is marginal quality or undersized, repeated high-current breaking can weld the contacts closed. The relay stays mechanically closed even when the BMS commands it open, and you lose disconnect protection entirely. I’ve seen this on systems that experienced frequent transient overcurrent trips after 50-100 disconnect cycles under high current, the discharge relay welded shut and the BMS could no longer protect the cells.
The proper solution is to size disconnect relays for 2-3x maximum expected continuous current and to use relays specifically rated for DC resistive load breaking. A 200A rated relay is adequate for 60-80A continuous, not for 200A continuous with frequent breaking. For systems with 100A+ normal operating current and 200A+ surge current, you need 300-400A rated relays minimum, and preferably contactors designed for DC breaking with proper arc suppression.
This is another place where following datasheet specs fails you. The datasheet might say the cells can discharge at 1C continuous (280A for a 280Ah cell). Your BMS might have a 200A rated disconnect relay. On paper, everything looks fine you’re only running at 0.7C. In reality, the relay can’t reliably break 200A hundreds of times over the system’s lifetime, and after 6-18 months you end up with a welded contactor and no overcurrent protection.
Practical Configuration for High-Current Systems
For systems that regularly pull 1.5C or higher discharge rates, I use these settings as starting points: discharge cutoff at 2.9-3.1V per cell (46.4-49.6V for 16S), cutoff delay of 3-5 seconds, reconnect voltage at 3.2-3.3V per cell (51.2-52.8V for 16S), and disconnect relays rated for at least 2x maximum continuous current. This creates enough margin for IR-induced voltage sag, enough delay to ignore startup transients, enough hysteresis to prevent oscillation, and enough relay capacity to handle breaking current reliably.
These settings sacrifice some theoretical capacity you’re preventing discharge below approximately 15-20% SOC to maintain voltage margin. But you gain system reliability. Loads that should work do work. The inverter doesn’t shut down randomly. The BMS doesn’t cycle on and off during normal operation. And you avoid the customer service nightmare of explaining why their battery “died at 60% charge” when really it just hit transient undervoltage during a high-current event.
The datasheet can’t tell you any of this because it’s testing single cells at controlled discharge rates, not complete systems with inverters, motor loads, and relay-based disconnect circuits. The gap between cell specification and system performance is enormous at high discharge rates, and it’s the installer’s responsibility to configure the BMS for actual operating conditions rather than laboratory test conditions that will never exist in the field.
Practical BMS Settings
After eight sections of explaining what goes wrong when you follow datasheets blindly, here’s what actually works. These are the configuration values I use on installations that need to run reliably for 10+ years without constant service calls. They’re conservative compared to datasheet maximums, but they account for all the real-world factors imbalance, temperature, IR, aging that datasheets ignore.
Start With Chemistry-Specific Baselines
LiFePO4 16S (48V nominal): Discharge cutoff 46.4-47.2V (2.9-2.95V per cell), charge cutoff 58.4V (3.65V per cell), absorption voltage 56.8-57.6V (3.55-3.6V per cell), float voltage 53.6V (3.35V per cell). These settings provide 0.4-0.45V margin below the datasheet 2.5V minimum discharge and operate absorption 50-100mV below maximum charge voltage to allow balancing.
NMC 13S (48V nominal): Discharge cutoff 42.9-43.55V (3.3-3.35V per cell), charge cutoff 54.6V (4.2V per cell), absorption voltage 53.3-53.95V (4.1-4.15V per cell), float voltage 50.7V (3.9V per cell). NMC requires tighter voltage control than LFP the voltage window is narrower and the consequences of over-voltage are more severe. I run absorption 50-100mV below maximum and discharge cutoff 0.55-0.65V above the typical 2.75V datasheet minimum.
LiFePO4 8S (24V nominal): Discharge cutoff 23.2-23.6V (2.9-2.95V per cell), charge cutoff 29.2V (3.65V per cell), absorption voltage 28.4-28.8V (3.55-3.6V per cell), float voltage 26.8V (3.35V per cell). Same per-cell values as 16S systems, just scaled to half the cell count.
These are starting points, not final values. Every installation requires adjustment based on specific conditions: expected load profiles, temperature extremes, cell quality, and aging state.
Add Margins for Environmental Conditions
If your installation sees temperatures below 0°C during operation, add 0.1-0.15V per cell to discharge cutoff for every 10°C below 0°C. A system operating down to -10°C needs discharge cutoff around 3.1-3.15V per cell (49.6-50.4V for 16S LFP) instead of the baseline 2.9-2.95V. This compensates for the voltage-temperature coefficient and prevents cold-weather shutdowns.
For installations in hot climates battery enclosures that see 45-50°C in summer reduce absorption voltage by 0.05-0.1V per cell to account for increased balancing difficulty at elevated temperature. Internal resistance is higher when hot, which means voltage sag is worse, which means you need more margin between absorption voltage and charge cutoff to avoid triggering HV disconnect during balancing.
If the installation is at altitude above 1,500 meters pay attention to thermal management. Convective cooling is less effective in thin air, and batteries in sealed enclosures can run 5-10°C hotter than they would at sea level. This affects both IR (increases voltage sag) and balancing effectiveness (reduced balancing current capacity at high temperature). I typically add another 0.05V margin to discharge cutoff for high-altitude installations to compensate for increased IR.
Configure Time-Based Protections
Discharge cutoff delay: 3-5 seconds for systems with motor loads or inverters that have high startup surge. 1-2 seconds for systems with resistive loads only. Zero delay is almost never appropriate even LED lighting and electronics can have inrush current that causes momentary voltage sag. The delay must be long enough to ignore transients but short enough to protect against sustained over discharge.
Charge cutoff delay: 1-2 seconds. This is shorter than discharge delay because overvoltage is generally more damaging than brief undervoltage, and charge current transients are less severe than discharge transients. You want to react quickly to genuine overvoltage while still filtering out measurement noise or brief voltage spikes.
Absorption time: 2-4 hours minimum for solar systems. 1-2 hours for AC-powered systems with consistent charge current. The limiting factor is how long it takes passive balancing to equalize cells at 35-60mA bleed current. A 100mV imbalance across cells requires roughly 2 hours to correct if the balancing current differential is 50mA and cell capacity is 280Ah. Don’t terminate absorption based on current taper let it run on timer to ensure balancing completes.
Set Appropriate Hysteresis Values
Discharge reconnect voltage should be 0.2-0.3V per cell above cutoff voltage (3.2-4.8V pack hysteresis for 16S). If discharge cutoff is 46.4V, reconnect at 50-51V. This prevents oscillation during loads with variable current and gives the battery time to stabilize after a disconnect event. Smaller hysteresis causes rapid cycling. Larger hysteresis works but means the battery needs to recover significantly before loads can restart, which frustrates customers.
Charge reconnect voltage should be 0.1-0.15V per cell below cutoff voltage (1.6-2.4V pack hysteresis for 16S). If charge cutoff is 58.4V, reconnect at 56.8-57.2V. This is smaller than discharge hysteresis because charge current doesn’t have the same inrush characteristics as discharge current, and you want to resume charging relatively quickly after a brief overvoltage event.
Balancing start threshold: 30-50mV. The BMS activates balancing when any cell exceeds others by this amount. Smaller thresholds mean more frequent balancing (good for tight voltage control, increases component wear). Larger thresholds mean less frequent balancing (reduces resistor heating, allows more imbalance). I use 30mV for new systems and 40-50mV for aged systems where some permanent imbalance is unavoidable.
Account for Cell Aging Over Time
New cells have low internal resistance and tight capacity matching. After 1,000 cycles, IR has typically increased 30-50% and capacity spread has widened. After 2,000 cycles, IR might be 2x original and capacity variance could be 5-8% between best and worst cells. Your BMS settings need margin for this degradation, or you’ll have a system that works fine for the first 2-3 years and then develops problems as cells age.
The conservative approach is to configure settings for cells at 70-80% of rated life from day one. This means you’re operating with excessive margin initially the system could deliver slightly more capacity if you set cutoffs more aggressively but you maintain reliable operation throughout the pack’s service life. The alternative is to set aggressive cutoffs initially and then reconfigure the BMS every 1-2 years as cells age, which most installers won’t do.
In practice, I set initial discharge cutoff at 2.9-2.95V per cell knowing that this provides adequate margin for new cells and will still be safe when IR has doubled and capacity has faded 20-30%. If you set discharge cutoff at 2.6-2.7V to maximize initial capacity, you’ll be at 2.4-2.5V effective (after IR voltage drop) once cells are aged, which is below the safe operating range and accelerates further degradation.
Cell-Level vs. Pack-Level Cutoffs
If your BMS monitors individual cell voltages in real-time, configure both cell-level and pack-level cutoffs. Cell-level catches individual weak cells before they’re over-discharged. Pack-level catches system-level problems like excessive total discharge or measurement errors in the cell monitoring circuits.
Cell-level discharge cutoff: 2.9-2.95V per cell. Cell-level charge cutoff: 3.65V per cell (for LFP). These are the primary protection thresholds.
Pack-level discharge cutoff: 46.4V (16S LFP, equivalent to 2.9V average per cell). Pack-level charge cutoff: 58.4V (16S LFP, equivalent to 3.65V average per cell). These provide backup protection if cell monitoring fails or if voltage measurement on one channel becomes unreliable.
The pack-level cutoffs should be set to trigger at approximately the same total pack voltage as the cell-level cutoffs would, but they’re measuring a different thing—total series voltage rather than individual cell voltage. This redundancy catches failures in the cell monitoring circuits themselves. I’ve seen BMS boards where one voltage sensing channel drifted out of calibration by 50-100mV over two years; pack-level cutoff caught the problem even though cell-level monitoring was giving bad data.
Example Configuration: 16S280Ah LiFePO4 Solar System
Here’s a complete configuration for a common installation—48V nominal, 14.3kWh capacity, solar charging, mixed loads including motor-driven well pump, temperature range -5°C to +40°C, expected 3,000+ cycle life:
- Discharge parameters: Cutoff 47.2V (2.95V per cell), delay 5 seconds, reconnect 50.4V (3.15V per cell), maximum continuous current 200A, maximum peak current 300A for 10 seconds.
- Charge parameters: Cutoff 58.4V (3.65V per cell), delay 2 seconds, reconnect 57.6V (3.6V per cell), maximum charge current 100A, absorption voltage 57.6V, absorption time 3 hours, float voltage 53.6V (3.35V per cell).
- Balancing: Start threshold 40mV, balancing current approximately 50mA per cell, active during 3.5-3.65V voltage range.
- Cell-level limits: Discharge cutoff 2.95V, charge cutoff 3.65V, over-temperature 55°C, under-temperature -10°C for charging / -20°C for discharging.
- Capacity-based cutoffs (if BMS supports): Low SOC alarm at 20%, disconnect at 10%, high SOC 95% (prevents attempting 100% charge that might cause imbalance).
These settings sacrifice approximately 15% of theoretical pack capacity—you’re operating between roughly 10% and 90% SOC instead of 0% to 100%—but you gain reliable operation across temperature extremes, protection against IR-induced voltage sag, adequate balancing time, and margin for 5+ years of cell aging before settings need revision.
When to Adjust Settings After Installation
Monitor individual cell voltages for the first 50-100 cycles. If any cell consistently hits charge cutoff significantly before others (>100mV difference), reduce absorption voltage by 50mV and extend absorption time by 1 hour. If cells show increasing imbalance over time despite long absorption periods, you have either failing cells or inadequate balancing current for the level of imbalance consider active balancing BMS or cell replacement.
If you see discharge cutoff triggering under loads that should be supported (voltage recovers immediately, plenty of capacity remaining), increase discharge cutoff by 0.1-0.2V per cell or increase cutoff delay by 2-3 seconds. If you see no discharge cutoffs but customers report unexpectedly short runtime, you might have set cutoff too conservatively check cell voltages under load and consider reducing cutoff by 0.05-0.1V per cell if there’s adequate margin.
After 1,000-1,500 cycles, or every 2-3 years, pull BMS logs and evaluate whether discharge events are approaching cutoff more frequently. If the margin between normal discharge endpoint and cutoff is shrinking cells now routinely reaching 3.0V when they previously stopped at 3.15V you need to increase discharge cutoff by 0.1-0.15V per cell to compensate for increased IR from aging.
What This Looks Like Compared to Datasheet Settings
A datasheet says 2.5-3.65V operating range. My settings use 2.9-3.6V (for absorption) or 2.9-3.65V (for charge cutoff). I’ve “lost” 0.4V on the bottom end and 0.05V on the top end—about 12-15% of the cell’s voltage range. For a 280Ah cell, that translates to roughly 35-42Ah of unusable capacity per cell, or 560-670Wh for a 16S pack.
That sounds like a lot. But it’s capacity you could never reliably access anyway because of imbalance, temperature effects, IR voltage drop, and aging. The customer who bought a 14.3kWh pack might get 12.5-13kWh of usable capacity with proper BMS settings, versus someone who configured to datasheet specs, got 13.5-14kWh initially, and now gets 10-11kWh after two years because imbalance and premature cutoffs have eaten the margin.
The goal isn’t to extract maximum theoretical capacity. It’s to deliver consistent, reliable capacity over the system’s lifetime. That requires conservative BMS configuration that accounts for everything datasheets don’t tell you about multi-cell pack behavior under real-world conditions.
Monitoring and Maintenance
A properly configured BMS prevents immediate failures, but long-term reliability requires active monitoring and periodic maintenance. I’ve watched too many battery systems slowly degrade over 12-18 months because nobody was looking at the data that would have caught the problem early. The BMS is recording cell voltages, current flow, and temperature continuously. The question is whether anyone is paying attention.
What Data Actually Matters
Most battery monitoring systems overwhelm you with data: real-time pack voltage, individual cell voltages, current, power, state of charge estimates, temperature, cycle count, time-to-empty calculations. Ninety percent of this is noise. What actually predicts failures and indicates needed maintenance can be reduced to four measurements taken at specific times.
- Individual cell voltages at end of absorption. This is your imbalance indicator. After a complete absorption cycle 3-4 hours at absorption voltage with current tapered to near zero all cells should be within 30-50mV of each other. If you see one cell at 3.58V and another at 3.45V after full absorption, you have a balancing problem or a failing cell. This gap will widen over time and eventually limit usable capacity.
- Individual cell voltages under moderate load. I use 0.5C discharge as the standard test point 140A for a 280Ah pack. At this load, cells should still track within 50-80mV of each other. If one cell is 150-200mV lower than pack average under load, it has higher internal resistance than the others. This is the cell that will hit discharge cutoff first, and it’s your early warning that capacity is becoming limited by a weak cell.
- Voltage sag between resting and loaded conditions. Measure pack voltage at rest (after 10+ minutes of no charge or discharge), then measure voltage under your typical maximum load. A healthy pack might sag 4-5V. As the pack ages and IR increases, this sag will grow to 6-8V or more. When sag exceeds 8V at your standard load current, you’re approaching the point where discharge cutoff margin is being consumed by IR, and you need to either reduce maximum load current or increase discharge cutoff voltage.
- Temperature rise during high-current operation. Cell temperature should increase 5-10°C during 1C discharge and return to ambient within 30-60 minutes after load removal. If you see 15-20°C temperature rise during moderate discharge, or if temperature doesn’t return to ambient within 90 minutes, you have either poor thermal management or increased internal resistance generating excessive heat. Both predict accelerated aging and potential thermal runaway risk.
Everything else SOC estimates, cycle counts, capacity calculations is derived data that depends on the accuracy of the BMS’s coulomb counting and voltage modeling. It’s useful for user interface but unreliable for diagnostics. I’ve seen BMS systems reporting 80% SOC when individual cell inspection showed cells at 3.05V (closer to 30% SOC). The derived data was wrong because the coulomb counter had drifted out of calibration. The cell voltages were factual and immediately showed the problem.
Logging Strategy for Early Problem Detection
Configure your BMS or monitoring system to log data at two different rates: high-frequency logging during charge/discharge events (every 10-30 seconds), and low-frequency logging during standby (every 10-30 minutes). High-frequency data catches transient events voltage sag during motor startup, brief overvoltage spikes during charge cutoff, temperature excursions during high current. Low-frequency data tracks long-term trends capacity fade, increasing imbalance, standby self-discharge rate.
What you’re looking for in the logs are inflection points moments where behavior changes. If discharge voltage sag has been consistent at 5.5V for 800 cycles and then suddenly increases to 7V, something changed. One cell might be developing high IR. The battery might be running hotter due to seasonal temperature changes. Loads might have increased. The inflection point tells you when to investigate, before the problem causes shutdowns.
I configure alert thresholds based on rate of change rather than absolute values. An alert for “cell imbalance exceeds 100mV” is less useful than “cell imbalance increased by 50mV in the past 30 days.” The first tells you there’s a problem now. The second tells you there’s a developing problem that will become critical in another 30-60 days, giving you time to schedule maintenance before the customer experiences failures.
Specific alerts I configure on every installation: cell voltage spread during absorption increased by more than 30mV compared to 30-day average (indicates worsening imbalance or failing balancing circuit), voltage sag at standard load increased by more than 1V compared to 90-day average (indicates IR increase from aging), any individual cell temperature exceeds 50°C during normal operation (thermal management problem), more than 3 disconnect events per week (cutoff margins are inadequate for actual operating conditions).
Warning Signs Before Failure
Increasing imbalance is the most common early warning. A pack that started with 30mV spread at end of absorption and now shows 80mV spread after six months is trending toward problems. If spread is increasing 10-15mV per month, you’ll hit 150-200mV within a year, at which point capacity loss becomes significant and customers notice reduced runtime.
The usual cause is inadequate absorption time or absorption voltage set too high (hitting charge cutoff before balancing completes). The correction is to extend absorption time to 4-5 hours and reduce absorption voltage by 50-100mV. Then monitor for 10-15 charge cycles to verify that imbalance stabilizes or decreases. If imbalance continues increasing despite proper absorption, you likely have a failing cell that needs replacement or a BMS balancing circuit that’s not functioning on one or more channels.
Reduced runtime relative to discharge depth is another key indicator. If customers report that their battery “dies faster than it used to,” pull the logs and check how much voltage the pack loses from full charge to disconnect. Initially, the pack might have discharged from 57.6V to 47.2V (10.4V total drop). If it’s now disconnecting at 49-50V (only 7.6-8.6V total drop), you’ve lost 20-30% of usable voltage range even though the BMS discharge cutoff hasn’t changed.
This happens when the weak cell hits cutoff earlier due to capacity loss or increased IR. The BMS is protecting that cell, but from the pack voltage perspective, you’re shutting down at a higher voltage than before. The correction depends on cause: if it’s imbalance, fix balancing. If it’s a genuinely failing cell, replace it. If it’s uniform aging across all cells, consider lowering discharge cutoff by 0.1V per cell to recover some capacity, but verify under load that you’re not approaching actual cell overdischarge.
Periodic Equalization Charging
Even with proper absorption settings, lithium packs benefit from periodic equalization—an extended absorption cycle at slightly lower voltage than normal. I recommend this every 30-60 days depending on how heavily the system is cycled. The equalization parameters are: absorption voltage 56.4-56.8V (3.525-3.55V per cell for 16S LFP), duration 6-8 hours, current limited to 0.05-0.1C (14-28A for a 280Ah pack).
The lower voltage ensures no cell approaches charge cutoff even if imbalance is significant. The extended time gives balancing circuits maximum opportunity to equalize cells—at 50mA bleed current, 8 hours is 400mAh of balancing capacity, enough to correct substantial imbalance. The low current prevents the strong cells from hitting HV cutoff while weak cells are still charging, which is what happens during normal absorption if imbalance is severe.
I’ve brought badly imbalanced packs—200mV spread, customers complaining of 50% capacity loss—back to 40-50mV spread and normal capacity through three or four equalization cycles over 2-3 weeks. This only works if cells are fundamentally healthy and the problem is balancing, not if you have a genuinely failing cell. But most imbalance I see in the field is accumulated balancing deficit from inadequate absorption, not cell failure, and equalization corrects it without hardware changes.
Some BMS boards have an equalization mode built in. If yours doesn’t, you can manually equalize by programming a one-time absorption at the lower voltage and extended time. Solar systems can do this automatically overnight when loads are low and morning sun will complete the equalization cycle. Grid-tied systems can equalize on a schedule. The key is to do it regularly before imbalance accumulates to the point where capacity loss is noticeable.
Seasonal Adjustment Requirements
Temperature extremes require seasonal BMS reconfiguration if your system operates across wide temperature ranges. In late fall, before the first hard freeze, increase discharge cutoff by 0.1-0.15V per cell to compensate for cold-weather voltage drop. In spring, reduce it back to baseline. This prevents the winter shutdowns that make customers think their battery failed.
Some modern BMS boards support temperature compensation you program the base cutoff voltage and a compensation coefficient (mV per °C), and the BMS automatically adjusts cutoffs based on measured temperature. This works if your BMS accurately measures cell temperature and if you trust the compensation algorithm. I’ve seen temperature compensation that was too aggressive (adjusted 8mV/°C when the actual coefficient is closer to 4mV/°C) and caused summer over-discharge. Manual seasonal adjustment is more work but gives you precise control.
Hot weather adjustments are less critical for discharge cutoff increased IR from heat is partially offset by reduced voltage-temperature coefficient but absorption voltage might need reduction. If summer cell temperatures exceed 40°C regularly, reduce absorption voltage by 0.05V per cell to prevent thermal stress on cells held at high voltage in high heat. The combination of high voltage and high temperature accelerates calendar aging more than either factor alone.
When to Replace Cells vs. Adjust Settings
A single failing cell in a 16S pack creates a dilemma: replace the one cell, replace all cells, or adjust BMS settings to accommodate the weak cell. Replacing one cell rarely works well the new cell has different aging history and will immediately become either the strongest or weakest cell in the pack, creating new imbalance. Replacing all cells is expensive and throws away 15 cells that might have 70-80% life remaining.
The practical middle ground is to adjust BMS settings to protect the weak cell until the entire pack reaches end of life, then replace all cells together. If Cell 7 now has 240Ah capacity while others have 275Ah, increase discharge cutoff by 0.1-0.15V per cell so Cell 7 hits cutoff before it’s over discharged. You lose some pack capacity maybe 10-12% but you avoid the expense and imbalance problems of partial cell replacement.
This works for packs where the weakest cell still has 80-85% of pack average capacity. Below that, the capacity loss from accommodating the weak cell becomes too large, and cell replacement makes economic sense. I typically recommend replacement when the weakest cell is more than 20% below pack average capacity, which usually means the entire pack is at 70-75% of original capacity and due for replacement anyway.
The key is to identify the problem early through monitoring. If you catch a cell declining from 95% to 88% of pack capacity, you can adjust settings and get another 1-2 years of service. If you don’t notice until the cell is at 65% of pack capacity and customers are complaining about shutdowns, you’re past the point where adjustment helps and into forced replacement territory.
Tools That Actually Help
Most BMS monitoring requires a smartphone app or computer interface. These are fine for checking current status but terrible for long-term trend analysis. The data is trapped in the app, refresh rates are inconsistent, and there’s no way to export logs for detailed analysis. I strongly recommend systems that support data export CSV files, MQTT publishing, Modbus/Ethernet interfaces that can feed data to a proper monitoring platform.
For serious installations, I use standalone battery monitors that log independently from the BMS devices like the Victron BMV series or dedicated battery data loggers. These record voltage, current, and temperature continuously to local storage or cloud services, creating a permanent record that survives BMS failures or reconfigurations. When you’re troubleshooting a problem that developed over months, having six months of continuous data is invaluable.
For cell-level voltage monitoring, you need either a BMS with per-cell logging or external cell voltage monitors. Don’t rely on BMS displays that show current cell voltages you need logged data showing voltage at specific charge states (end of absorption, during discharge, at rest). Taking manual readings with a multimeter is better than nothing but impractical for catching intermittent problems.
Temperature monitoring needs multiple points: at minimum, measure one cell near the center of the pack (hottest) and one near the edge (coolest), plus ambient temperature. The difference tells you how effective your thermal management is. If center cells run 15-20°C hotter than edge cells, you have poor heat distribution and the center cells will age faster than the edges, creating progressive imbalance.
The Maintenance Schedule That Prevents Problems
Monthly: Check cell voltage spread at end of absorption. Should be under 50mV. If over 80mV, schedule equalization charge. Check discharge cutoff events in logs more than 2-3 per month indicates inadequate margin for actual loads.
Quarterly: Verify voltage sag under standard load hasn’t increased more than 0.5V compared to previous quarter. Check that cell temperatures during operation stay under 45°C. Review cycle count and calculate expected remaining life most lithium cells are rated 3,000-5,000 cycles to 80% capacity.
Annually: Perform capacity test full discharge at 0.2-0.5C from full charge to discharge cutoff, measure actual amp-hours delivered vs. rated capacity. 90% or better is healthy. 80-90% is degraded but acceptable. Below 80% indicates approaching end of life. Check physical condition terminal corrosion, case swelling, signs of electrolyte leakage (rare but critical). Verify BMS firmware is current manufacturers occasionally release updates that fix balancing or measurement bugs.
This schedule catches problems early when they’re correctable through BMS adjustment or equalization, rather than late when they require hardware replacement. The monthly checks take 10 minutes if you have proper monitoring tools. The quarterly checks take 30 minutes. The annual test takes 4-6 hours but gives you definitive capacity data. For a system that’s expected to run 10-15 years, this is minimal maintenance that pays for itself in avoided failures and extended pack life.
Conclusion
This article began with a system that shut down at 50% SOC because its BMS was configured directly from the datasheet: 2.5 V per cell discharge cutoff. The fix required no hardware replacement only proper configuration. Raising the cutoff to 2.9 V per cell, lowering absorption voltage, correcting imbalance, and adding delay resolved the issue permanently. The system has now operated reliably for two years.
Yet the consequences of that initial mistake were real: lost customer confidence, unnecessary service calls, and wasted warranty effort. This outcome is common because datasheet specifications are routinely mistaken for BMS configuration values.
Cell datasheets describe the behavior of a single, ideal cell under laboratory conditions. Real systems consist of multiple imperfect cells in series, operating across temperature extremes, under high current, aging at different rates, and relying on limited passive balancing. Running a system at datasheet voltage limits leaves no margin for voltage sag, temperature effects, imbalance, or aging and guarantees nuisance trips, stranded capacity, and accelerated degradation.
Reliable BMS configuration requires margin. Discharge cutoffs must be set above datasheet minimums to protect weak cells under load and in cold conditions. Absorption voltage must be set below datasheet maximums to allow balancing to complete without triggering high-voltage cutoffs. Delays and hysteresis are essential to prevent transient-driven shutdowns. These choices typically sacrifice 10–15% of theoretical capacity but deliver more usable energy over the system’s lifetime by preventing imbalance and premature cutoffs.
Getting this wrong has predictable consequences: systems that fail in winter, packs that never fully balance, batteries that shut down under normal loads, and progressive capacity loss that masquerades as hardware failure. These problems generate service calls, warranty claims, and dissatisfied customers not because lithium batteries are unreliable, but because they were configured without regard for real operating conditions.
There is also a safety dimension. Datasheet-based cutoffs can allow individual cells to be driven well outside safe limits while pack voltage appears normal. Conservative, cell-level margins protect against over-discharge, lithium plating, accelerated SEI growth, and long-term cell damage failures that no inverter or charge controller can correct after the fact.
The correct approach is iterative. Start with conservative settings, monitor real behavior, and adjust based on measured data over the first months of operation and as seasonal and aging effects emerge. Systems that are monitored and tuned stay stable. Systems that are configured once and forgotten do not.
The difference between reliable installations and chronic problem systems is rarely hardware. The cells are usually fine. The BMS is usually fine. The failure point is configuration specifically, treating datasheets as configuration guides instead of as boundary conditions.
Configure for reality, not the lab. That is how lithium systems deliver the performance, longevity, and reliability they are capable of.

Hi, i am Engr. Ubokobong a solar specialist and lithium battery systems engineer, with over five years of practical experience designing, assembling, and analyzing lithium battery packs for solar and energy storage applications, and installation. His interests center on cell architecture, BMS behavior, system reliability, of lithium batteries in off-grid and high-demand environments.